Building effective engineering metrics and KPIs can be a daunting task, especially for those who are new to the process. Fortunately, Keypup's configuration assistant provides a user-friendly solution that enables users to quickly create software engineering dashboards without the need to delve into complex custom formulas or filters right away. This streamlined approach facilitates quick adoption and empowers users to get started with valuable insights in no time.
In this article, we will guide you through the process of creating a software engineering dashboard using Keypup's configuration assistant.
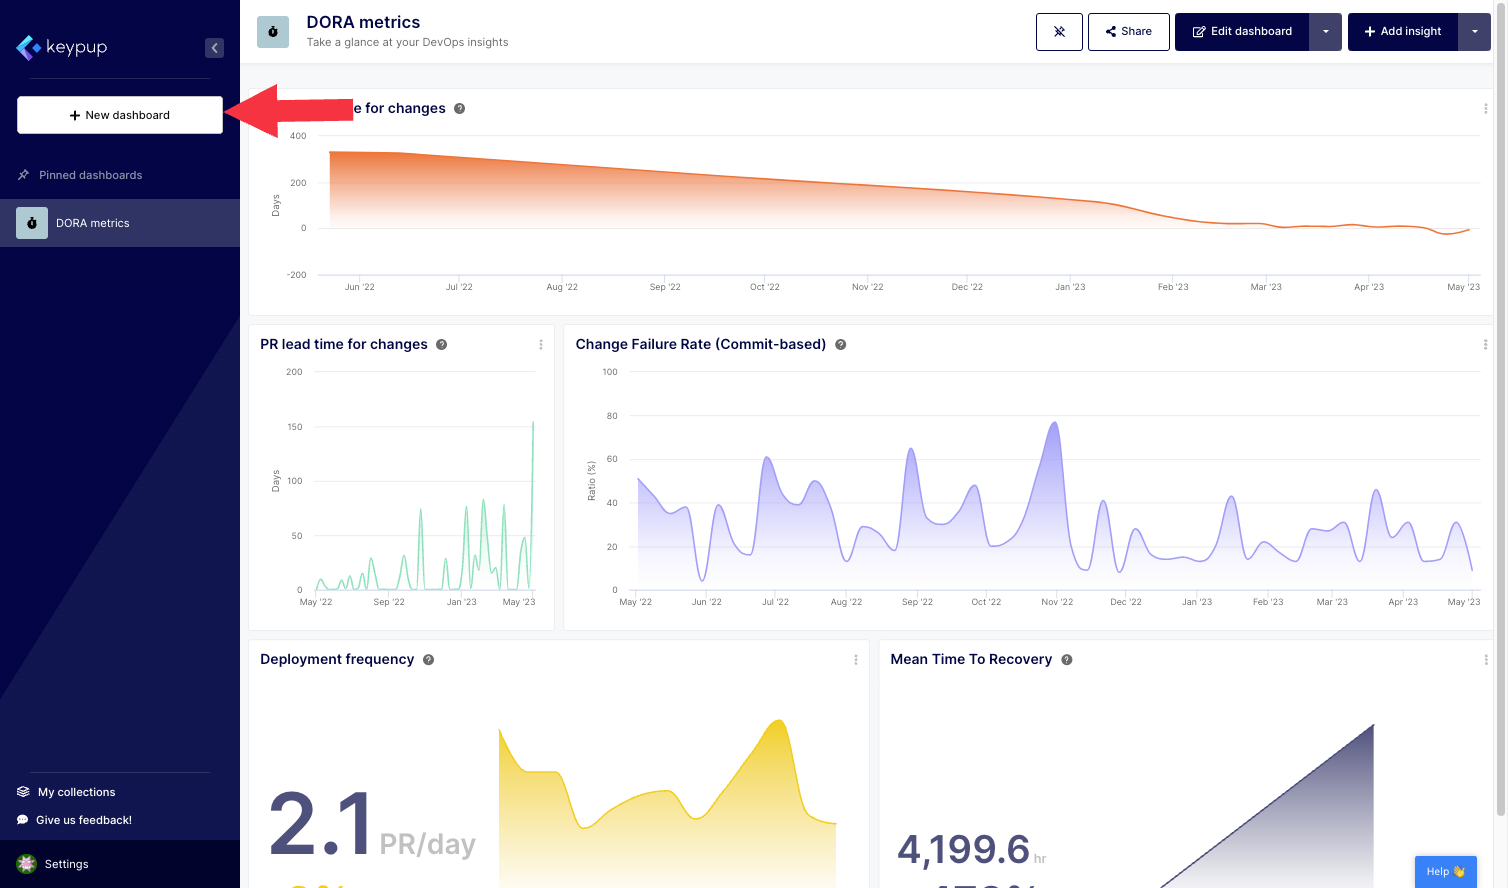
1. First, click on the "+ New dashboard" button located at the top of the left navigation panel.
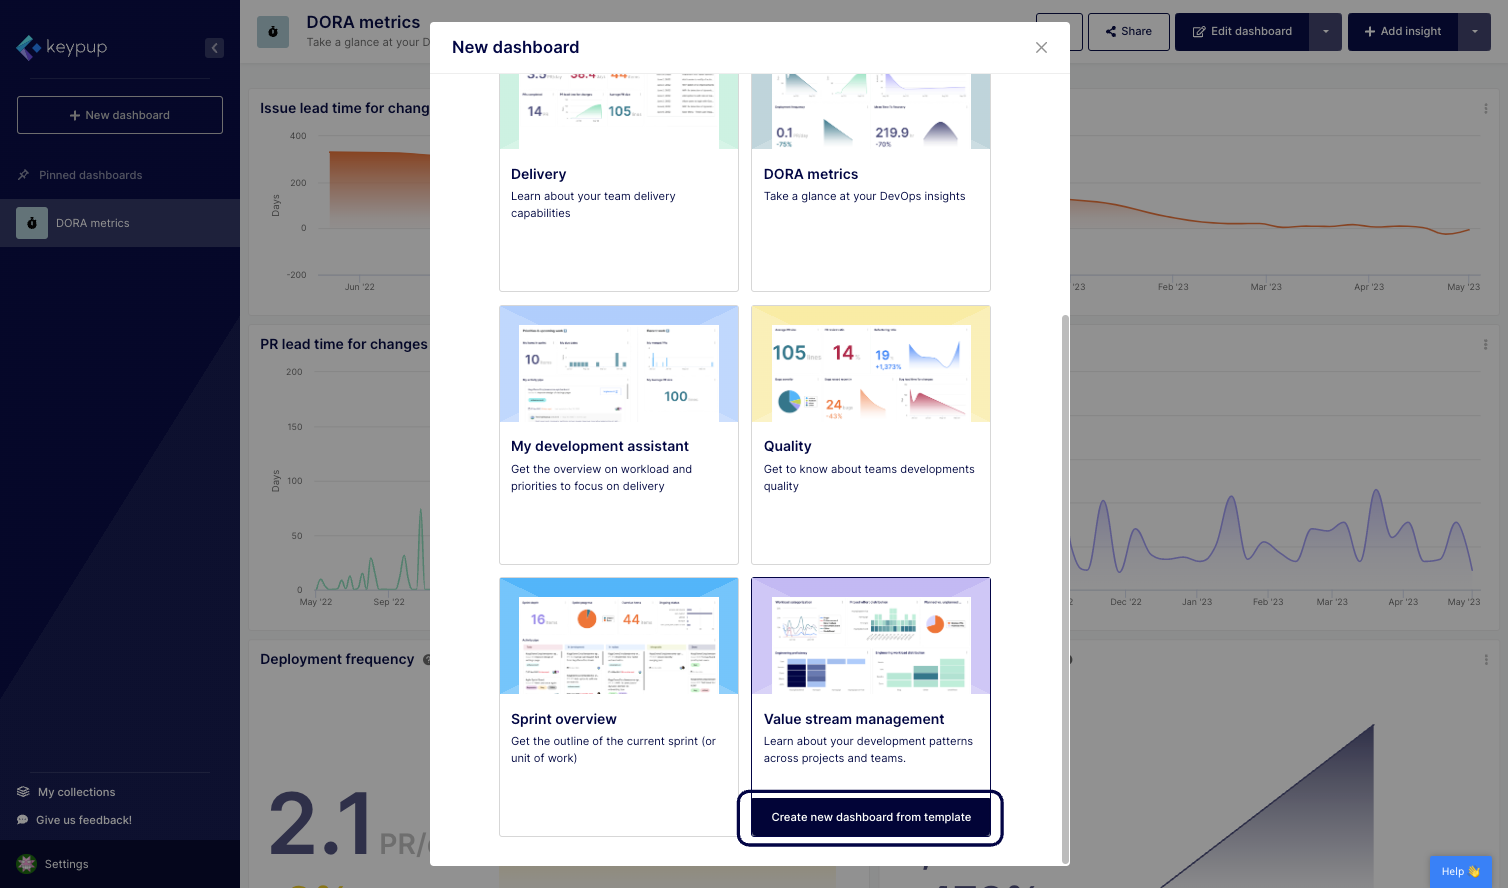
2. From there, you can select a dashboard from a variety of templates or start with a blank dashboard. Click on the "Create new dashboard from template" located below the template of your choice. This example shows the Value stream management dashboard.
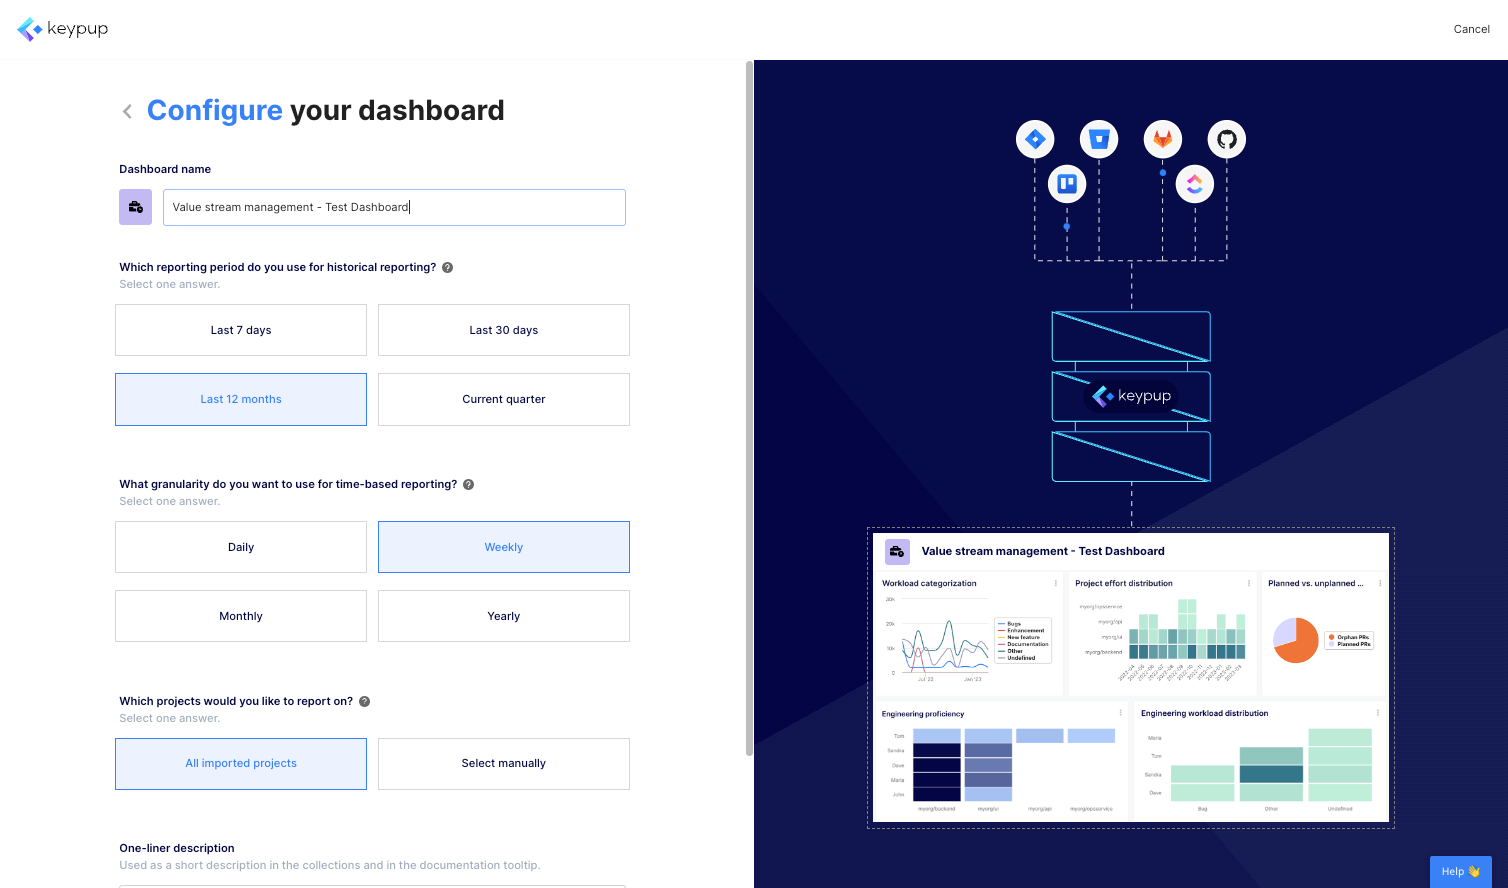
3. From this page, you can configure all the metrics contained in your dashboard by answering a few questions (such as time frame or project) and adjusting the title accordingly. The set of questions will vary based on the metrics contained in each dashboard template.
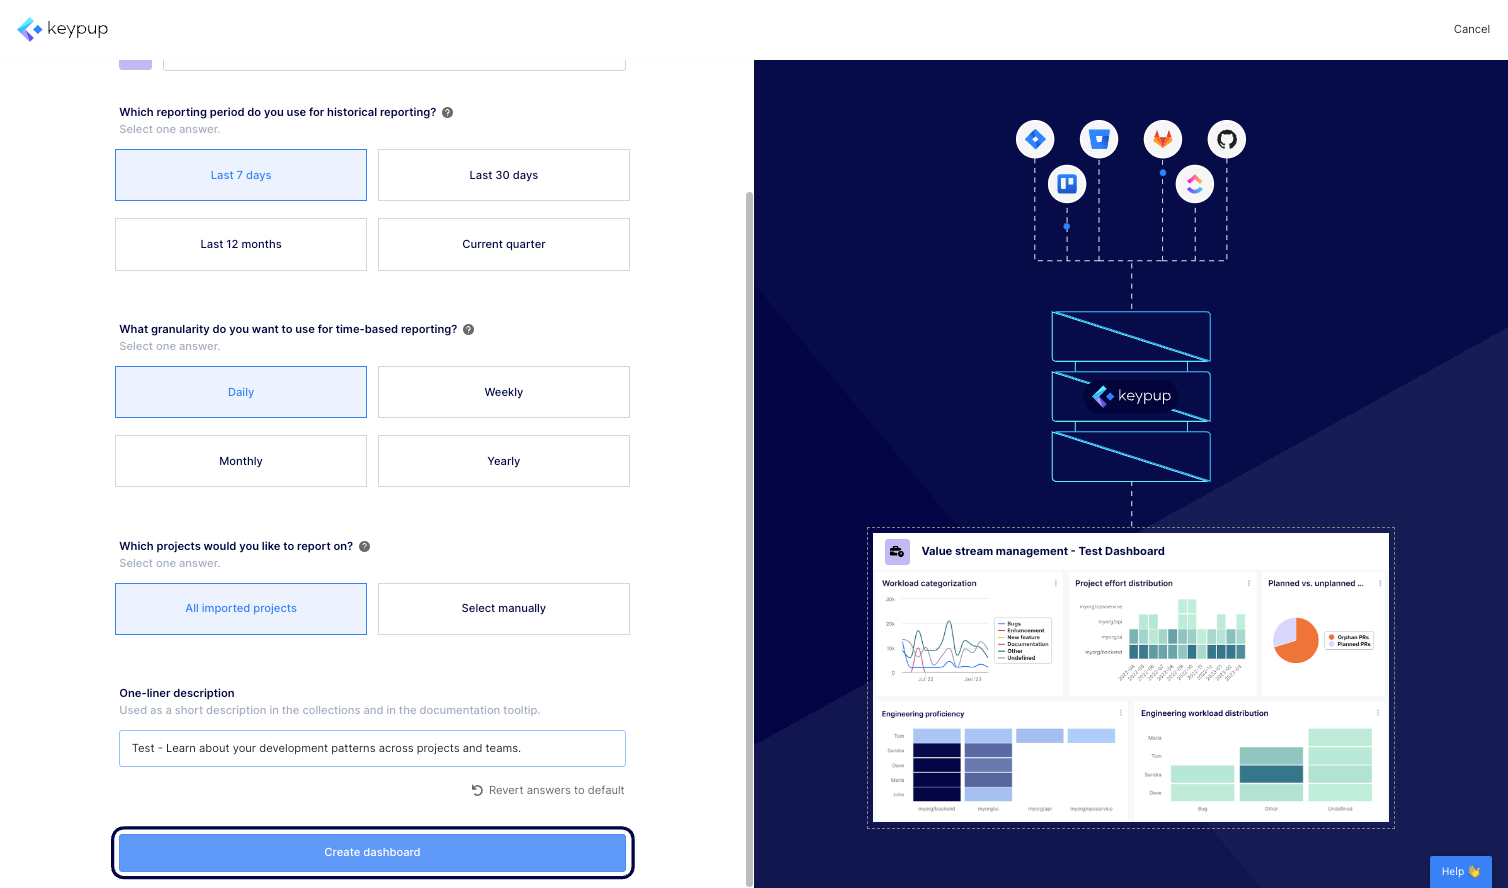
4. Once done, click on the "Create dashboard" button located at the bottom of this screen.
5. And that's it, your dashboard is now ready to explore and share.
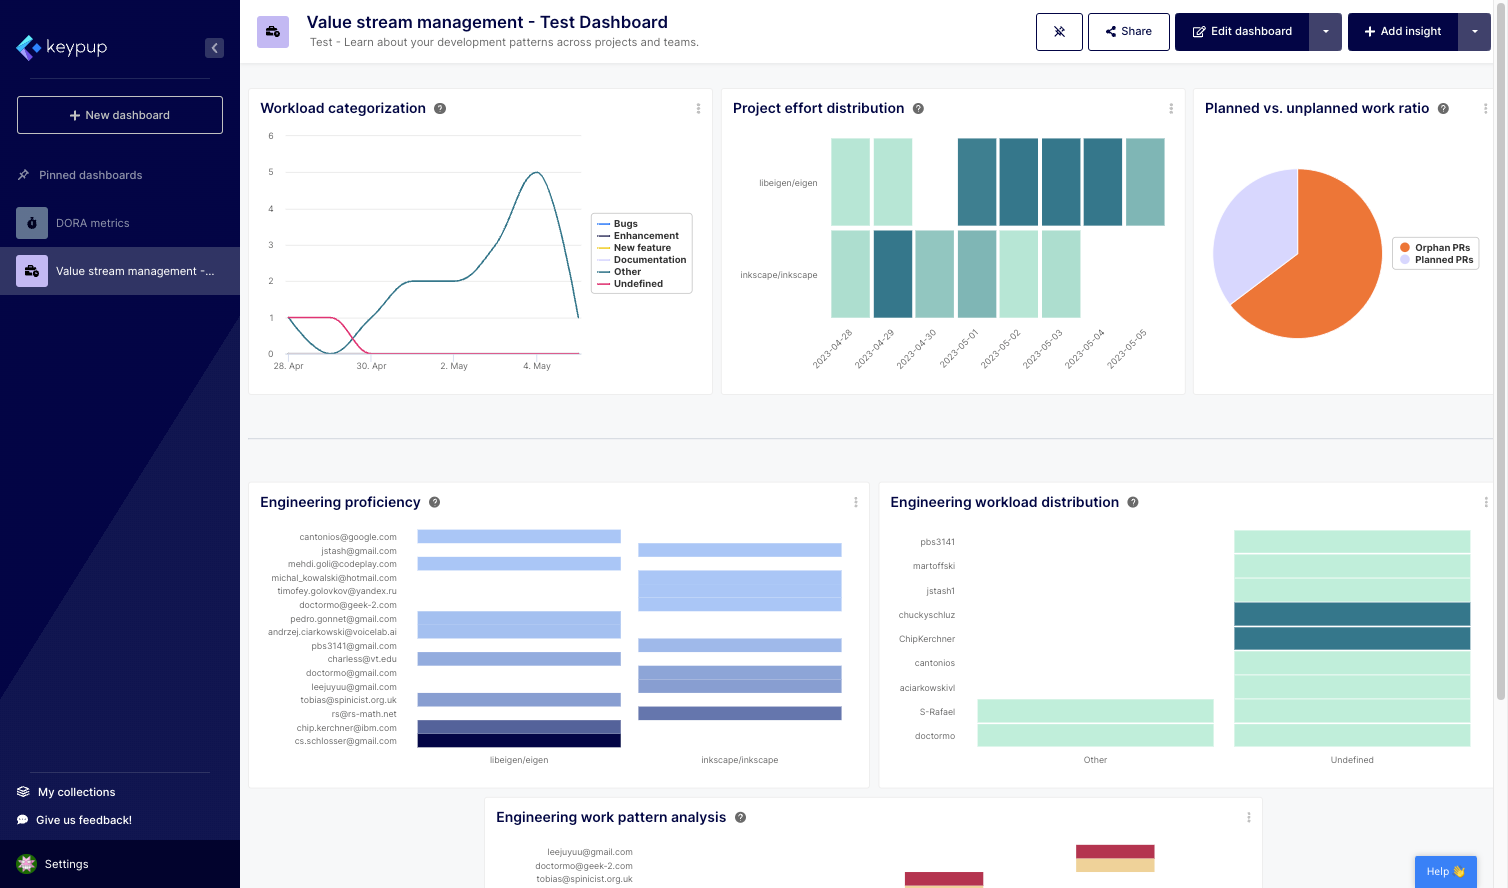
Keypup's configuration assistant empowers users to leverage the power of data analytics without being overwhelmed by complex technicalities. With a user-friendly approach and guided configuration process, teams can quickly adopt Keypup's platform and start harnessing the benefits of software engineering dashboards.
Now that you have the knowledge and tools to create your own software engineering dashboard, you can effectively monitor and optimize your team's performance, identify areas for improvement, and make informed decisions that drive success.
Take advantage of Keypup's configuration assistant today, and unlock the full potential of your software engineering metrics. By embracing data-driven insights, you can enhance collaboration, improve productivity, and propel your organization toward greater achievements.