TL;DR: AI coding assistants have rapidly become ubiquitous in software development, but measuring their actual impact remains elusive for most engineering organizations. Beyond anecdotal "feels faster" reports, quantifying AI's effect on velocity, code quality, cycle time, and ultimately ROI requires systematic SDLC analysis that correlates AI adoption with measurable outcomes. Keypup MCP Server enables data-driven assessment by analyzing before/after patterns, comparing AI-adopter vs. non-adopter performance, and calculating the financial impact of productivity gains against tool costs.
- Key Point 1: AI coding assistant adoption varies wildly within teams—some developers use them extensively, others ignore them—making aggregate metrics misleading; effective measurement requires developer-level adoption tracking correlated with individual performance changes.
- Key Point 2: The most significant AI impact appears in cycle time reduction (20-35% faster for routine tasks) and code review efficiency (AI-generated code gets fewer comments), but potential downsides include increased bug rates in complex logic and over-reliance that degrades debugging skills over time.
- Key Point 3: ROI analysis must account for both direct costs (subscription fees, infrastructure) and hidden costs (training time, review overhead for AI-generated code, technical debt from copy-paste patterns), balanced against productivity gains measured through SDLC data rather than self-reported surveys.
Introduction: The AI Coding Assistant Revolution and the Measurement Gap
In the past three years, AI coding assistants have transformed from experimental curiosities into essential development tools. GitHub Copilot, Amazon CodeWhisperer, Tabnine, Cursor, and dozens of competitors now serve millions of developers. The promises are compelling: 40% faster coding, 50% less time spent on boilerplate, 30% reduction in bugs through AI-suggested test cases. Venture capital has poured billions into AI-powered developer tools, betting that AI will fundamentally reshape how software is built.
But beneath the hype and the glossy marketing metrics lies an uncomfortable truth: most engineering organizations have no idea whether their AI tool investments are actually paying off.
Ask a CTO, "What's the ROI on our GitHub Copilot Enterprise licenses?" and you'll typically hear one of three responses:
- Anecdotal evidence: "Developers love it and say they're more productive"
- Vendor metrics: "GitHub says Copilot users are 55% faster"
- Shrugged admission: "We honestly don't know, but everyone else is using it so we need to as well"
None of these answers satisfy a CFO scrutinizing engineering budgets or a board evaluating the $500K annual spend on AI tooling. The measurement gap exists because traditional engineering metrics weren't designed to track AI impact. Velocity charts don't distinguish between human-written and AI-assisted code. Test coverage doesn't reveal whether AI suggested those tests. Cycle time improvements could come from process changes, team growth, or reduced scope rather than AI adoption.
The challenge compounds because AI impact is heterogeneous. Within the same team, one developer might complete features 40% faster with AI assistance while another sees no improvement or even slowdown due to time spent correcting AI hallucinations. Aggregate metrics hide this variance, making it impossible to identify patterns, optimize adoption, or make evidence-based decisions about tool selection and rollout strategies.
We rolled out Copilot to our entire 50-person engineering team 8 months ago. Cost: $380K/year. When I asked for metrics on whether it's working, I got...nothing. Developers "feel" more productive but our sprint velocity is basically unchanged. Code review time didn't drop. Bugs didn't decrease. I can't tell if we're getting value or just burning money on a shiny tool.
This article provides a systematic framework for measuring AI's true impact on your software development lifecycle. We'll explore what to measure, how to isolate AI effects from other variables, which metrics matter for ROI analysis, and how to use Keypup MCP Server to transform vague "AI adoption" into quantifiable outcomes that connect engineering performance with business value.
The State of AI in Software Development: Adoption Patterns and Use Cases
Before measuring AI impact, we need to understand the landscape: how teams are actually using AI tools, which use cases show promise, and where the hype exceeds reality.
Current AI Adoption: From Copilots to Full-Stack Agents
AI has infiltrated nearly every stage of the SDLC:
Code Generation (Most Mature)
- Line completion: AI suggests next lines as you type (GitHub Copilot, Tabnine)
- Function implementation: Describe desired function in comments, AI generates implementation
- Boilerplate expansion: AI writes repetitive CRUD operations, test scaffolds, configuration files
- Code translation: Convert code between languages or migrate APIs
Code Understanding (Growing Fast)
- Explanation: AI explains complex code blocks in natural language
- Documentation generation: AI writes docstrings, README files, API docs from code
- Codebase navigation: AI answers "where is the auth logic?" questions across millions of lines
Code Review & Quality (Emerging)
- PR review assistance: AI flags potential bugs, suggests improvements, writes review comments
- Security scanning: AI identifies vulnerabilities with context-aware analysis
- Refactoring suggestions: AI proposes cleaner patterns for messy code
Testing & Debugging (Early Stage)
- Test generation: AI writes unit/integration tests from implementation
- Bug localization: AI narrows down root cause from error messages and stack traces
- Fix suggestions: AI proposes code changes to resolve failing tests
Architecture & Planning (Experimental)
- System design: AI suggests architecture patterns for new features
- Dependency analysis: AI maps component relationships and impact blast radius
- Estimation: AI predicts task complexity from requirements
Adoption Variance: The 10x Disparity Within Teams
One of the most striking findings from early AI adoption studies is the enormous variance in usage patterns:
We analyzed GitHub Copilot usage logs across 200 developers. The top 20% of users accept AI suggestions 60%+ of the time and use Copilot for almost every file they touch. The bottom 40% barely use it—acceptance rates under 10%, often disabled entirely. The "average" productivity improvement metric is meaningless when actual experience varies from 'transformative' to 'unused.'
This disparity emerges for several reasons:
- Task type: AI excels at boilerplate but struggles with novel algorithms or complex business logic
- Developer experience: Junior developers may over-rely on AI and accept poor suggestions; senior developers cherry-pick high-value assistance
- Language/framework fit: AI trained on JavaScript/Python performs better than on Rust/Elixir with limited training data
- Work style: Some developers think in prose (good AI fit), others think in diagrams/whiteboarding (poor fit)
Measuring "team-level AI impact" without accounting for this variance is like measuring "average temperature" across a building with both freezers and ovens—technically accurate, practically useless.
The Productivity Paradox: Faster Code, Slower Thinking?
Early reports of massive productivity gains from AI coding assistants are now being tempered by more nuanced analysis:
My team's Copilot-heavy developers ship features faster in the short term, but I'm noticing patterns: they're less likely to question design decisions, more likely to accept the first solution that compiles, and struggle more when debugging edge cases because they don't deeply understand the code they 'wrote.' We're optimizing for speed but potentially degrading engineering judgment.
This observation highlights a critical measurement challenge: not all productivity gains are equal. Shipping code 30% faster matters little if it creates technical debt, increases bug rates, or degrades long-term maintainability. Comprehensive AI impact measurement must track both positive outcomes (velocity, cycle time) and potential negatives (bug rates, review overhead, debugging time, knowledge retention).
What to Measure: A Framework for AI Impact Assessment
Measuring AI's impact on software development requires tracking metrics across six dimensions:
1. Direct Productivity Metrics: Speed and Volume
The most obvious measures of AI impact focus on raw output:
- Code commit volume: Lines committed per developer per week (AI-assisted vs. non-assisted periods)
- Feature completion velocity: Story points or features delivered per sprint
- Cycle time: Time from first commit to production deployment
- PR size trends: Whether AI enables larger PRs (more code per change) or smaller PRs (faster iteration)
Why this matters: If AI doesn't increase raw output, it's not delivering its core promise.
Measurement challenge: Volume can increase without value—AI might generate verbose code where concise code would be better.
2. Code Quality Metrics: Bugs and Maintainability
Speed means nothing if quality degrades:
- Defect rate: Post-merge bugs per 1000 lines of code, AI-assisted vs. human-written
- Hotfix frequency: How often do AI-assisted features require emergency patches?
- Code complexity: Cyclomatic complexity, nesting depth, function length in AI-generated code
- Technical debt accumulation: Code duplication, anti-patterns, TODO comments in AI-assisted commits
Why this matters: AI code that ships fast but breaks often or becomes unmaintainable creates net-negative value.
Measurement challenge: Attribution—was that bug caused by AI suggestion or developer error in accepting/modifying it?
3. Review Efficiency Metrics: Collaboration Impact
AI affects not just the developer who uses it, but the team that reviews their work:
- Review cycle time: Time from PR creation to approval for AI-assisted vs. non-assisted PRs
- Review comment density: Comments per 100 lines—do AI PRs get more scrutiny or less?
- Approval speed: Do reviewers trust AI-generated code more or less than human-written code?
- Review bottlenecks: Are certain reviewers overwhelmed by increased PR volume from AI-accelerated developers?
Why this matters: If AI speeds up development but slows down review, the net cycle time improvement may be minimal.
Measurement challenge: Reviewer fatigue—are quick approvals a sign of efficiency or rubber-stamping?
4. Developer Experience Metrics: Satisfaction and Skill Development
Productivity isn't just output—it's sustainable output without burning out the team:
- Developer satisfaction: Survey-based metrics on AI tool helpfulness, frustration, trust
- Context-switching: Do developers spend more or less time searching documentation/Stack Overflow?
- Debugging time: Time spent debugging AI-suggested code vs. self-written code
- Skill development: Are junior developers learning or becoming dependent on AI?
Why this matters: Tools that improve velocity but increase developer frustration aren't sustainable long-term investments.
Measurement challenge: Self-reported metrics are subject to bias and placebo effects.
5. Financial Metrics: Costs vs. Benefits
ROI requires hard numbers on both sides of the ledger:
Costs:
- Direct tool subscriptions ($19-39 per developer per month for Copilot-tier tools)
- Infrastructure (cloud costs for self-hosted AI models)
- Training and onboarding (time investment in teaching developers to use AI effectively)
- Review overhead (additional time scrutinizing AI-generated code)
- Bug remediation (cost of fixing AI-introduced defects)
Benefits:
- Velocity increase (more features shipped per quarter × value per feature)
- Cycle time reduction (faster time-to-market × competitive advantage)
- Engineering capacity freed up (time saved on boilerplate redirected to strategic work)
- Reduced hiring needs (existing team handles more work)
Why this matters: CFOs and boards make decisions based on dollars, not "feels faster."
Measurement challenge: Attributing business outcomes (revenue, market share) to engineering velocity changes is complex.
6. Adoption and Usage Metrics: Who's Actually Using AI?
You can't measure impact if you don't know usage patterns:
- Adoption rate: Percentage of developers actively using AI tools
- Usage frequency: How often is AI consulted per coding session?
- Acceptance rate: Percentage of AI suggestions accepted vs. rejected
- Use case patterns: What tasks do developers use AI for? (boilerplate, tests, debugging, documentation)
- Adoption trajectory: Is usage increasing, stable, or declining over time?
Why this matters: Low adoption suggests tool/team mismatch; declining usage may indicate disillusionment.
Measurement challenge: Most AI tools don't expose detailed usage analytics to organizations.
Measuring AI Impact with Keypup MCP Server: A Data-Driven Approach
Now let's explore how to systematically measure AI's impact on your SDLC using Keypup MCP Server to analyze engineering data and correlate AI adoption with outcomes.
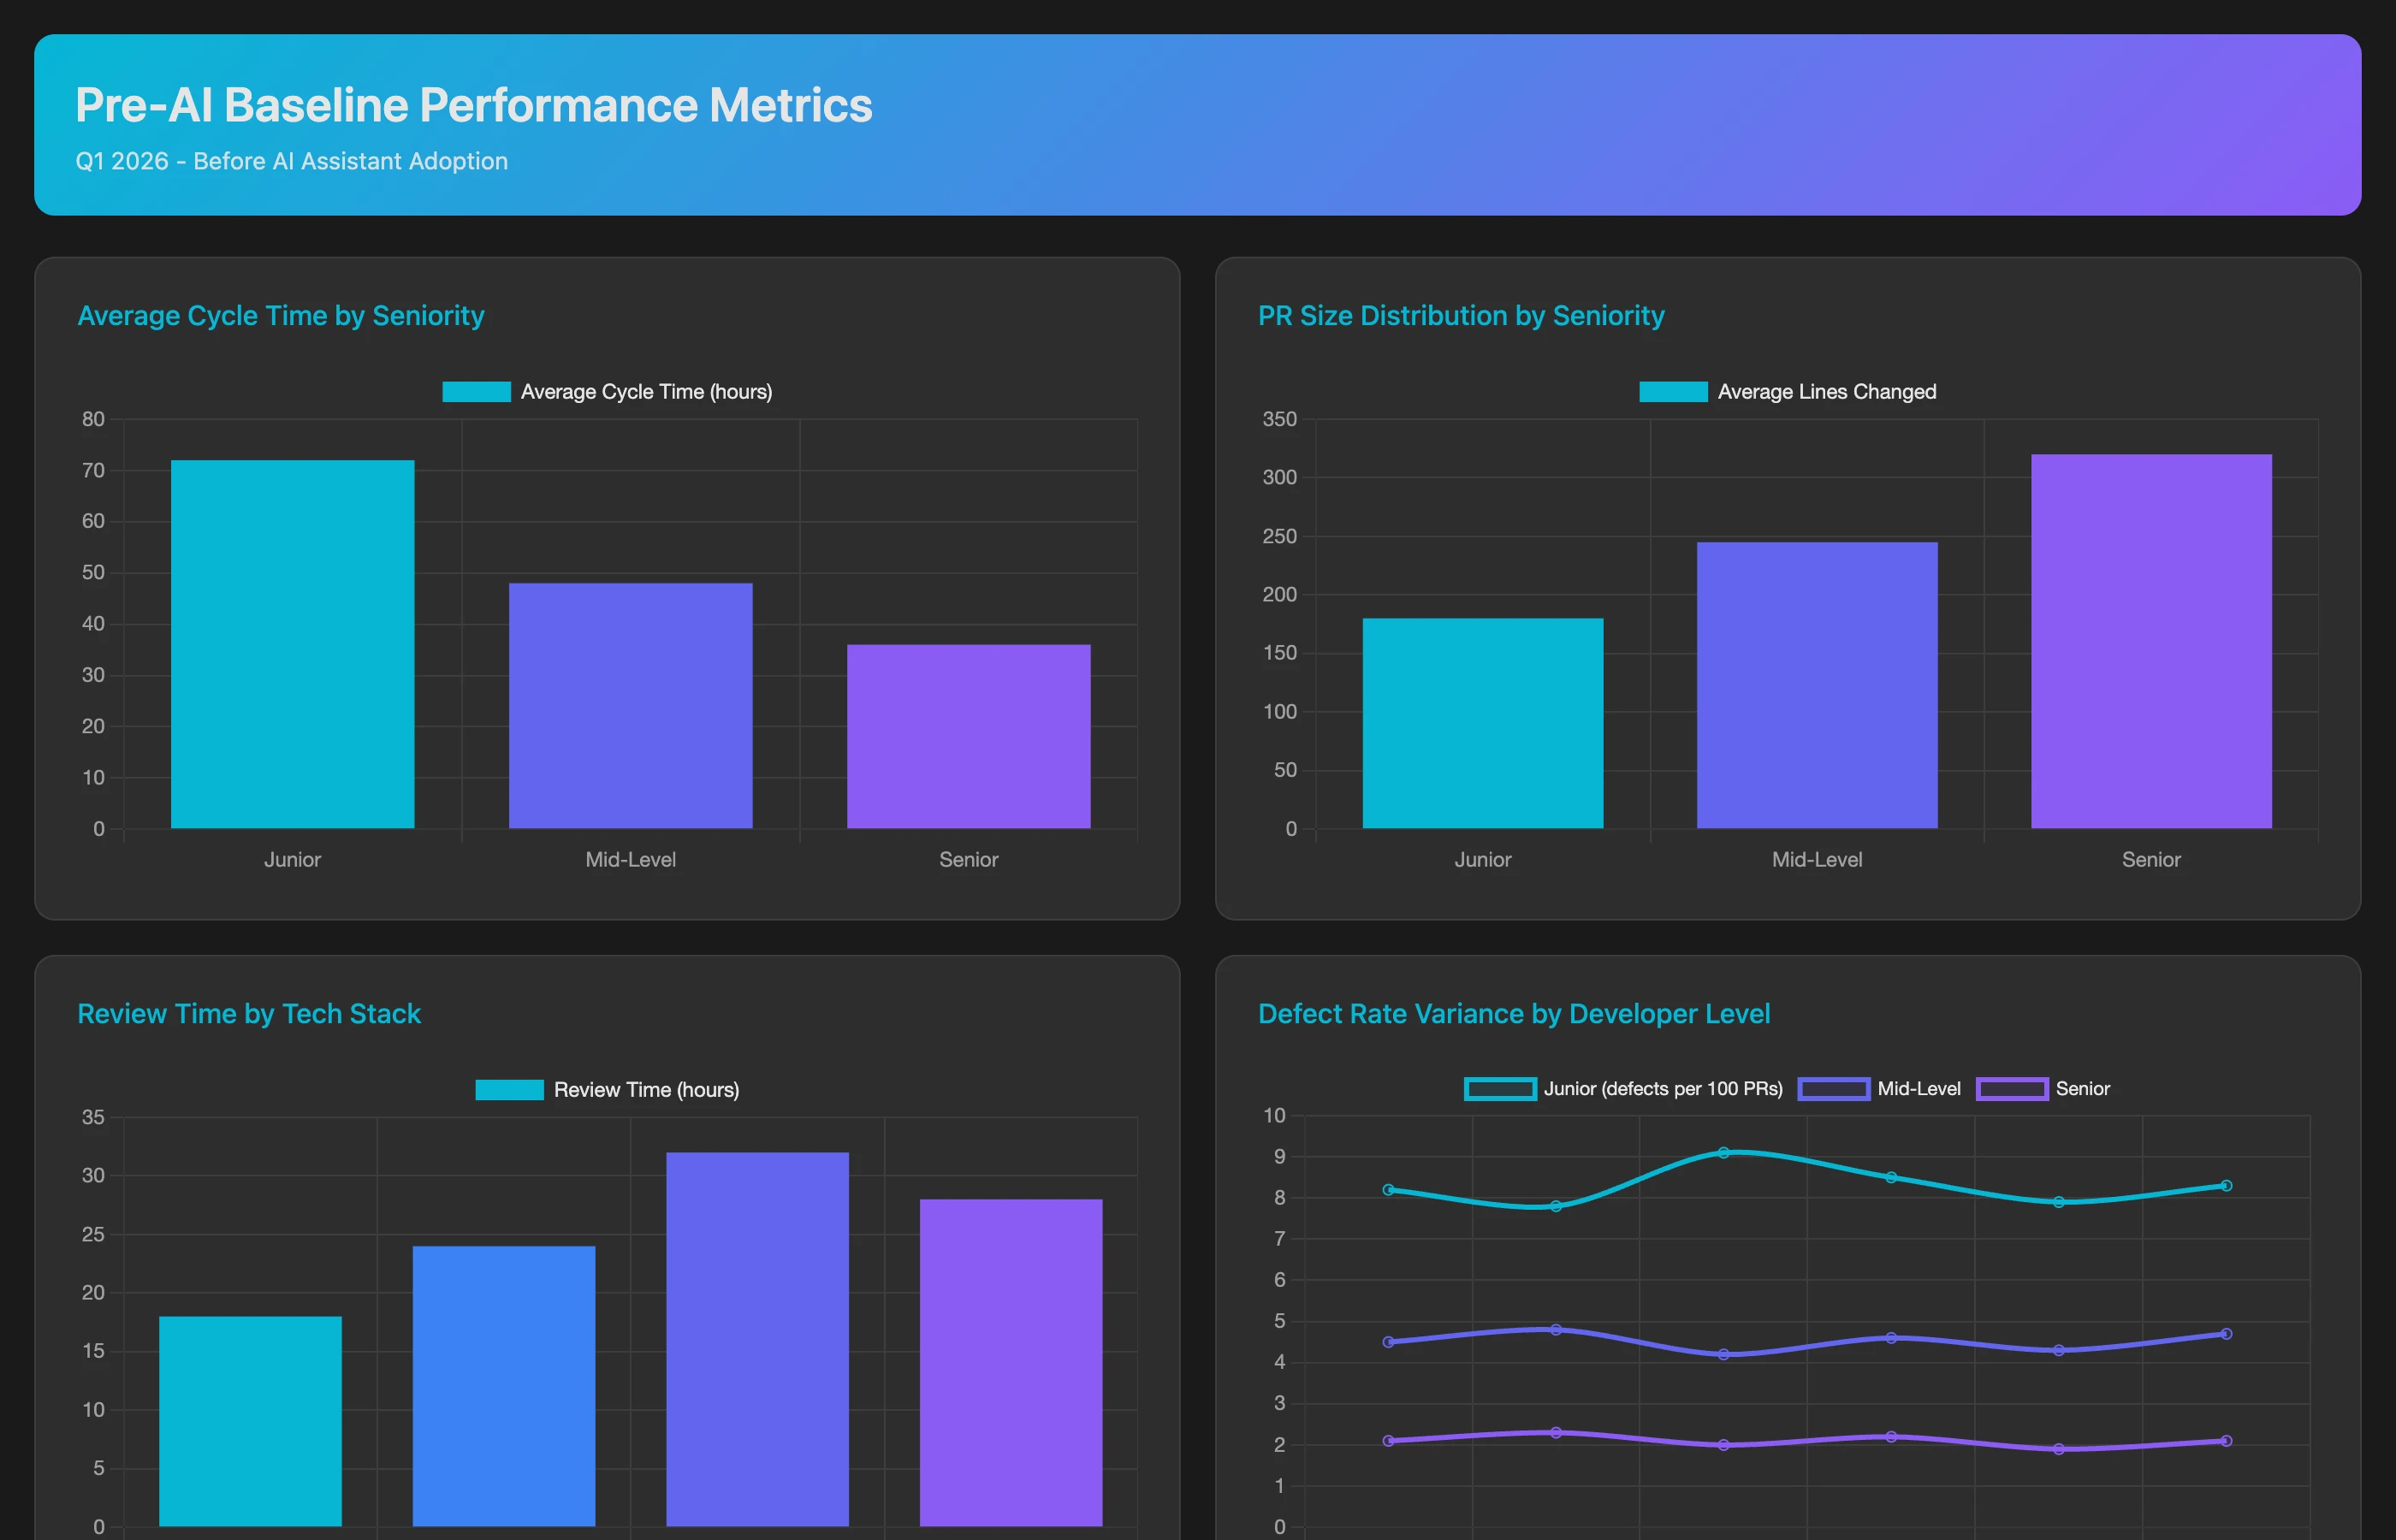
Before assessing AI impact, establish pre-adoption baselines:
Analyze engineering performance for Q1 2026 (before AI tool rollout) to establish baseline metrics. For each developer and team, calculate: average cycle time (commit to merge), PR size (lines changed), review time (PR creation to approval), defect rate (bugs per feature within 2 weeks of deployment), code commit frequency (commits per week), and feature completion velocity (story points per sprint). Segment by developer seniority (junior, mid, senior) and tech stack (frontend, backend, infrastructure). Show team-level aggregates and developer-level distributions.
This baseline allows before/after comparison once AI tools are deployed. Without it, you're measuring noise—any velocity improvement could be due to process changes, team maturity, or reduced scope rather than AI.
Tracking AI Adoption Patterns
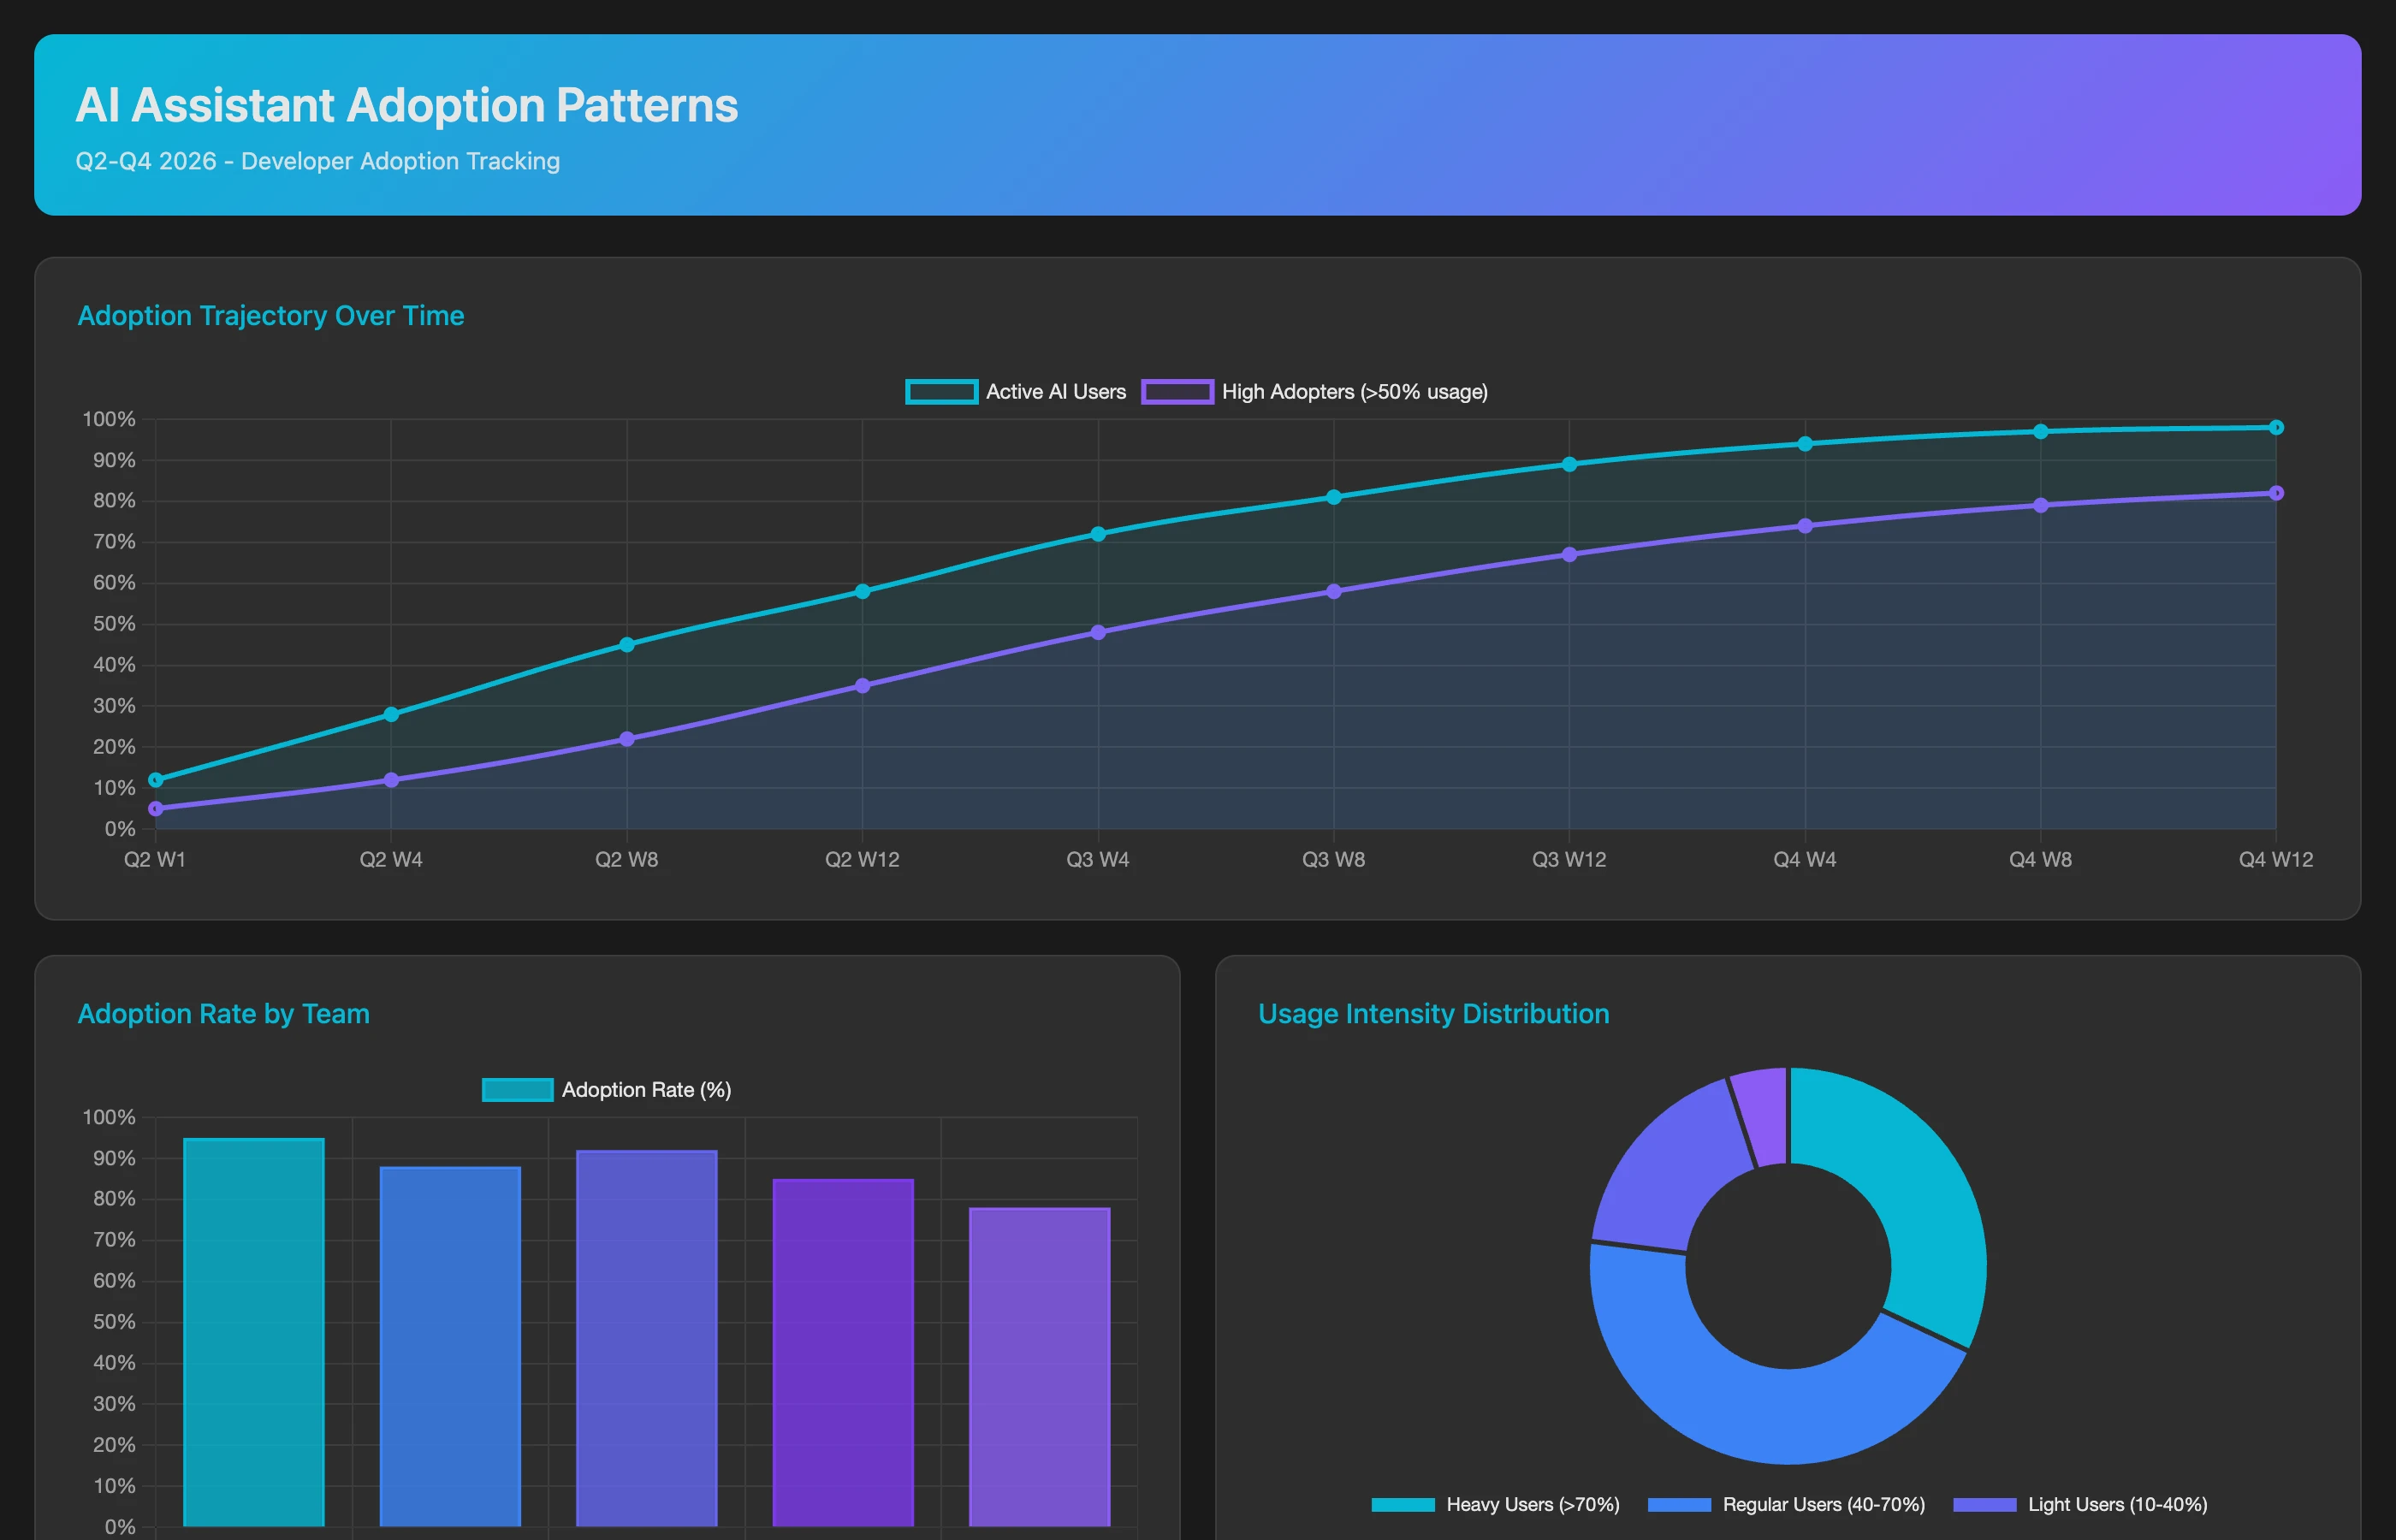
Not all developers adopt AI tools equally. Map usage patterns to identify high vs. low adopters:
Analyze developer-level AI tool adoption for Q2-Q3 2026 based on commit metadata and code patterns. Identify AI-assisted commits through: Copilot attribution tags, code comment patterns indicating AI generation, commit message references to AI tools, and file change patterns (sudden increases in code volume or test coverage). For each developer, calculate: AI adoption rate (percentage of commits showing AI indicators), adoption trajectory (is usage increasing or decreasing?), use case patterns (which file types and code patterns appear in AI-assisted commits), and peer adoption (how does individual usage compare to team average?). Flag developers with high adoption (over 60% AI-assisted commits) and low adoption (under 10%).
This analysis reveals the adoption distribution that aggregate metrics hide. You can't measure "AI impact on the team" if 40% of the team isn't using AI.
Comparing Velocity: AI Adopters vs. Non-Adopters
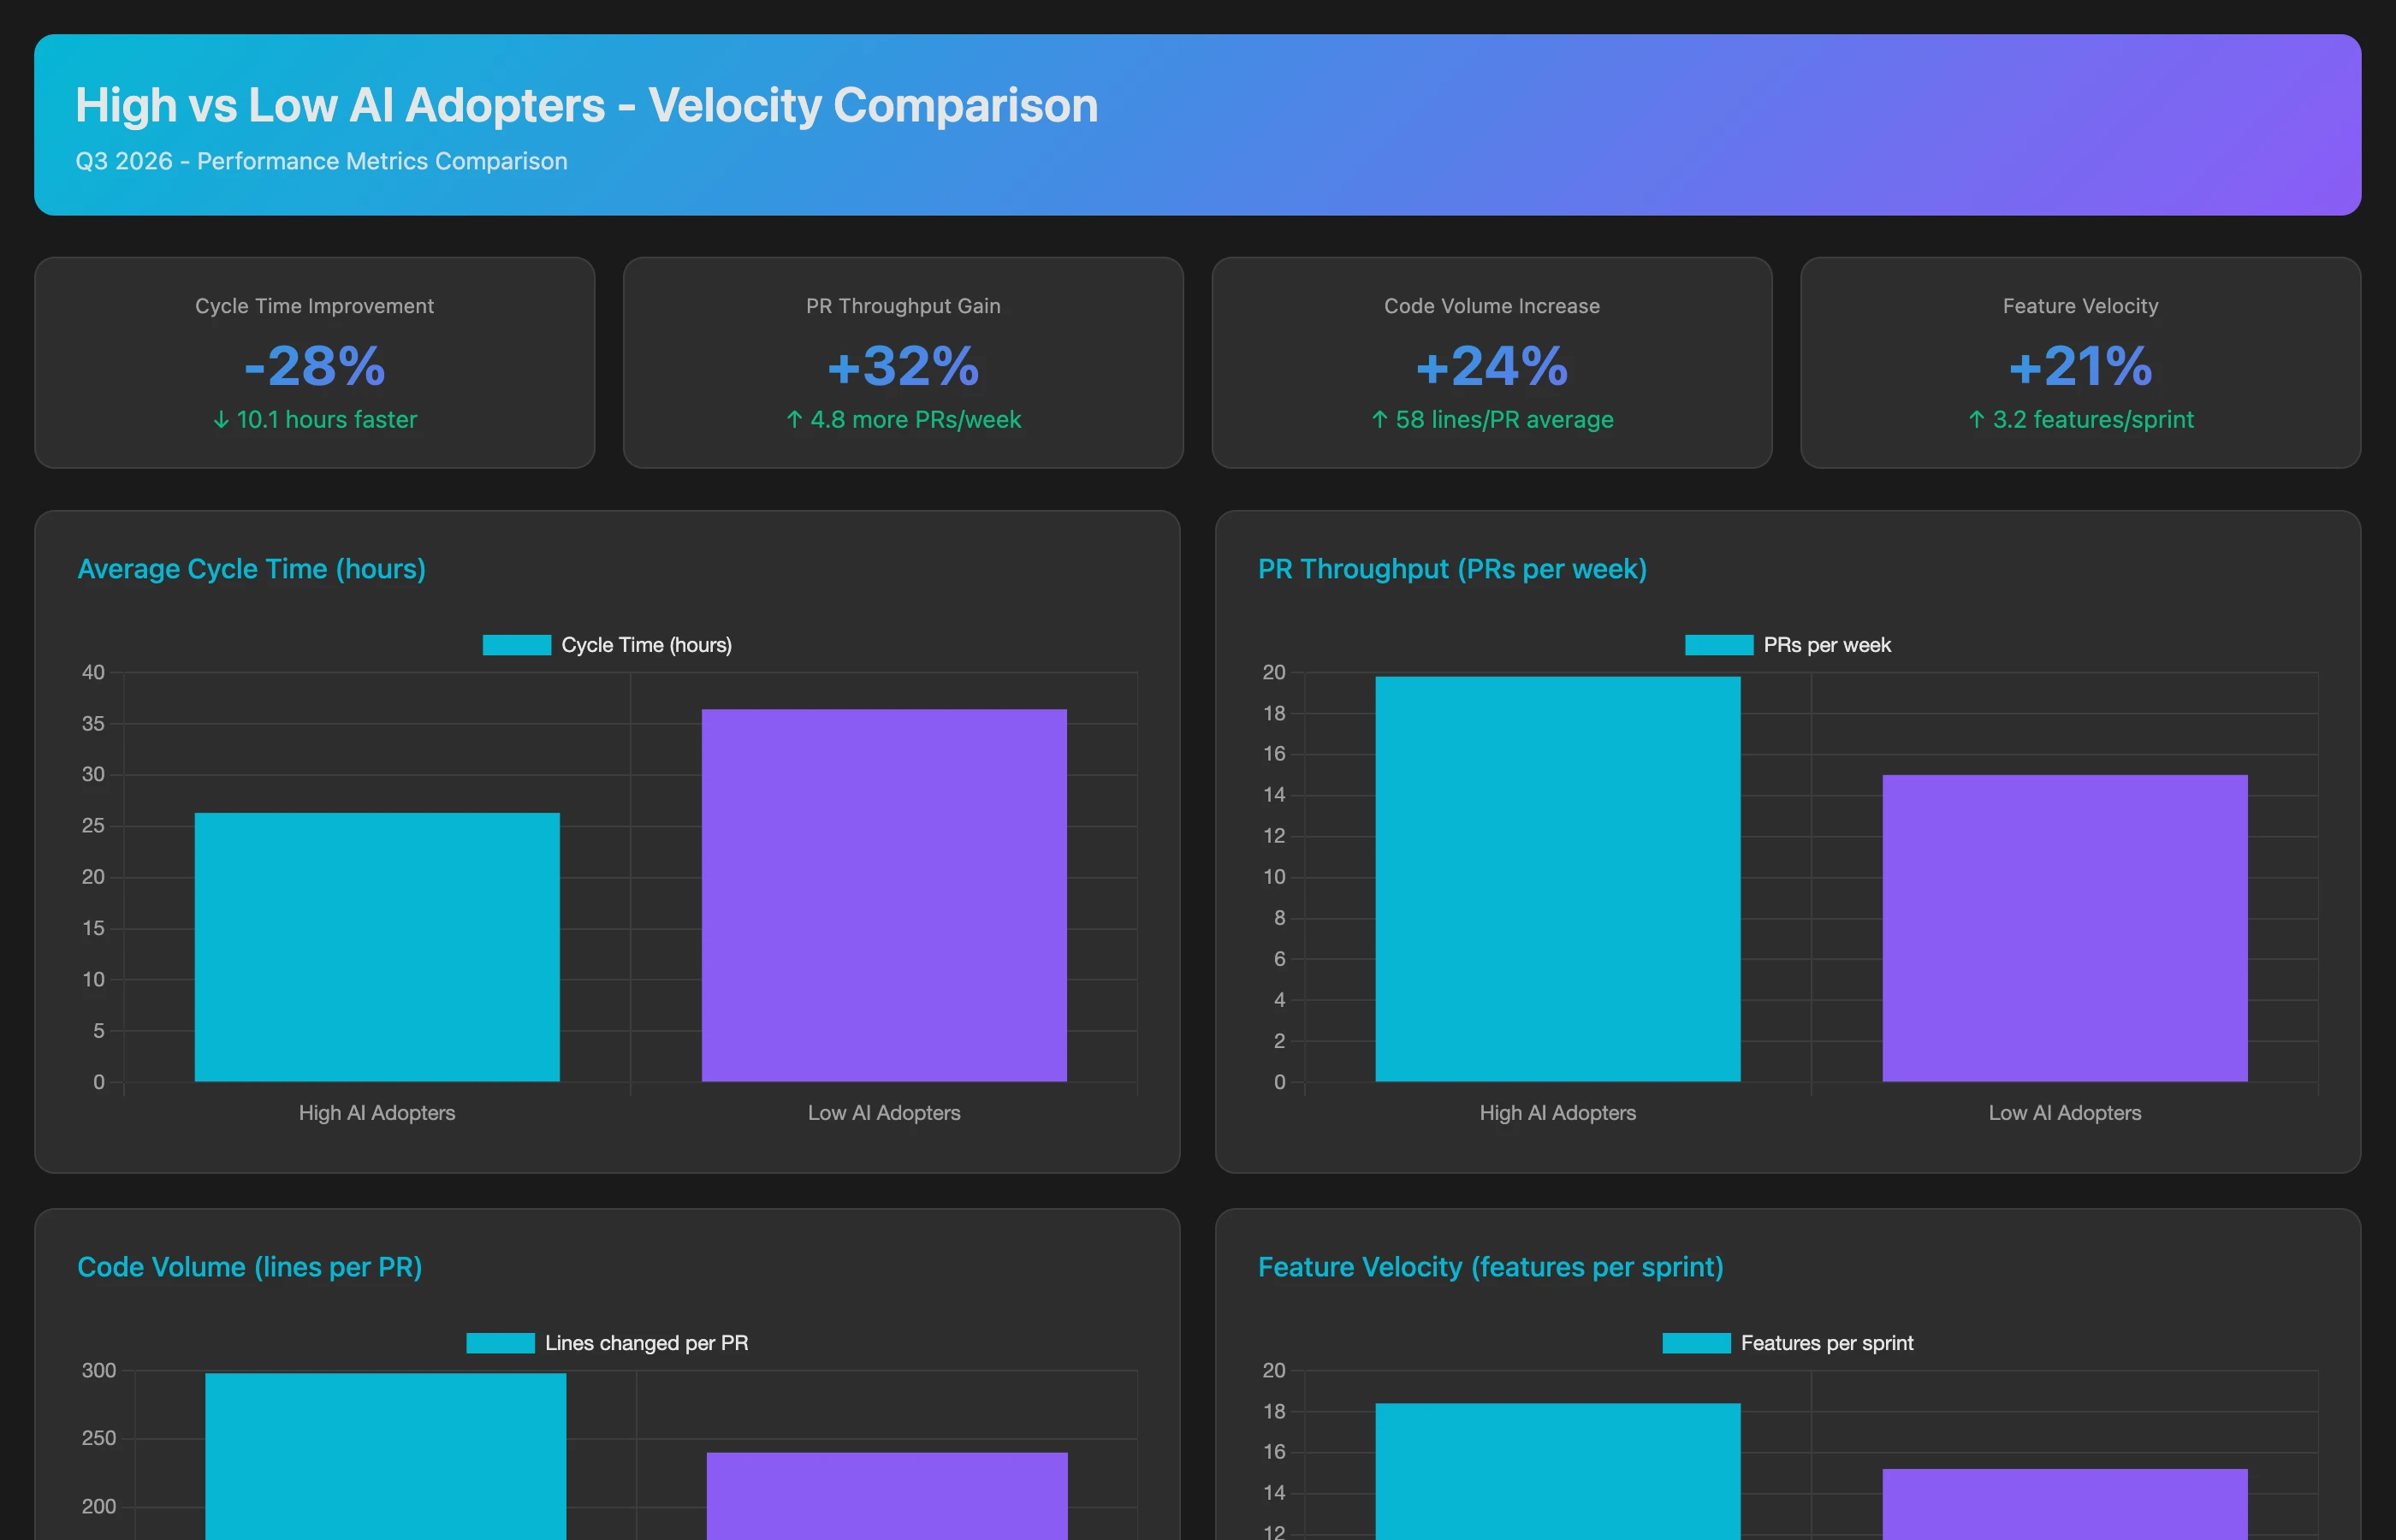
Control for confounding variables by comparing high-adopter vs. low-adopter cohorts:
Compare engineering velocity between high AI adopters (over 50% AI-assisted commits) and low AI adopters (under 20% AI-assisted commits) for Q2-Q3 2026. For each cohort, calculate: average cycle time (commit to production), PR throughput (PRs merged per week per developer), code volume (lines committed per week), feature velocity (story points completed per sprint), and work item completion rate (Jira issues closed per week). Control for seniority by comparing within experience bands (junior-to-junior, senior-to-senior). Show the percentage difference between high and low adopter cohorts for each metric.
This cohort analysis isolates AI effects from developer skill differences. If high adopters show 25-35% faster cycle times even when controlling for seniority, that's strong evidence of AI impact.
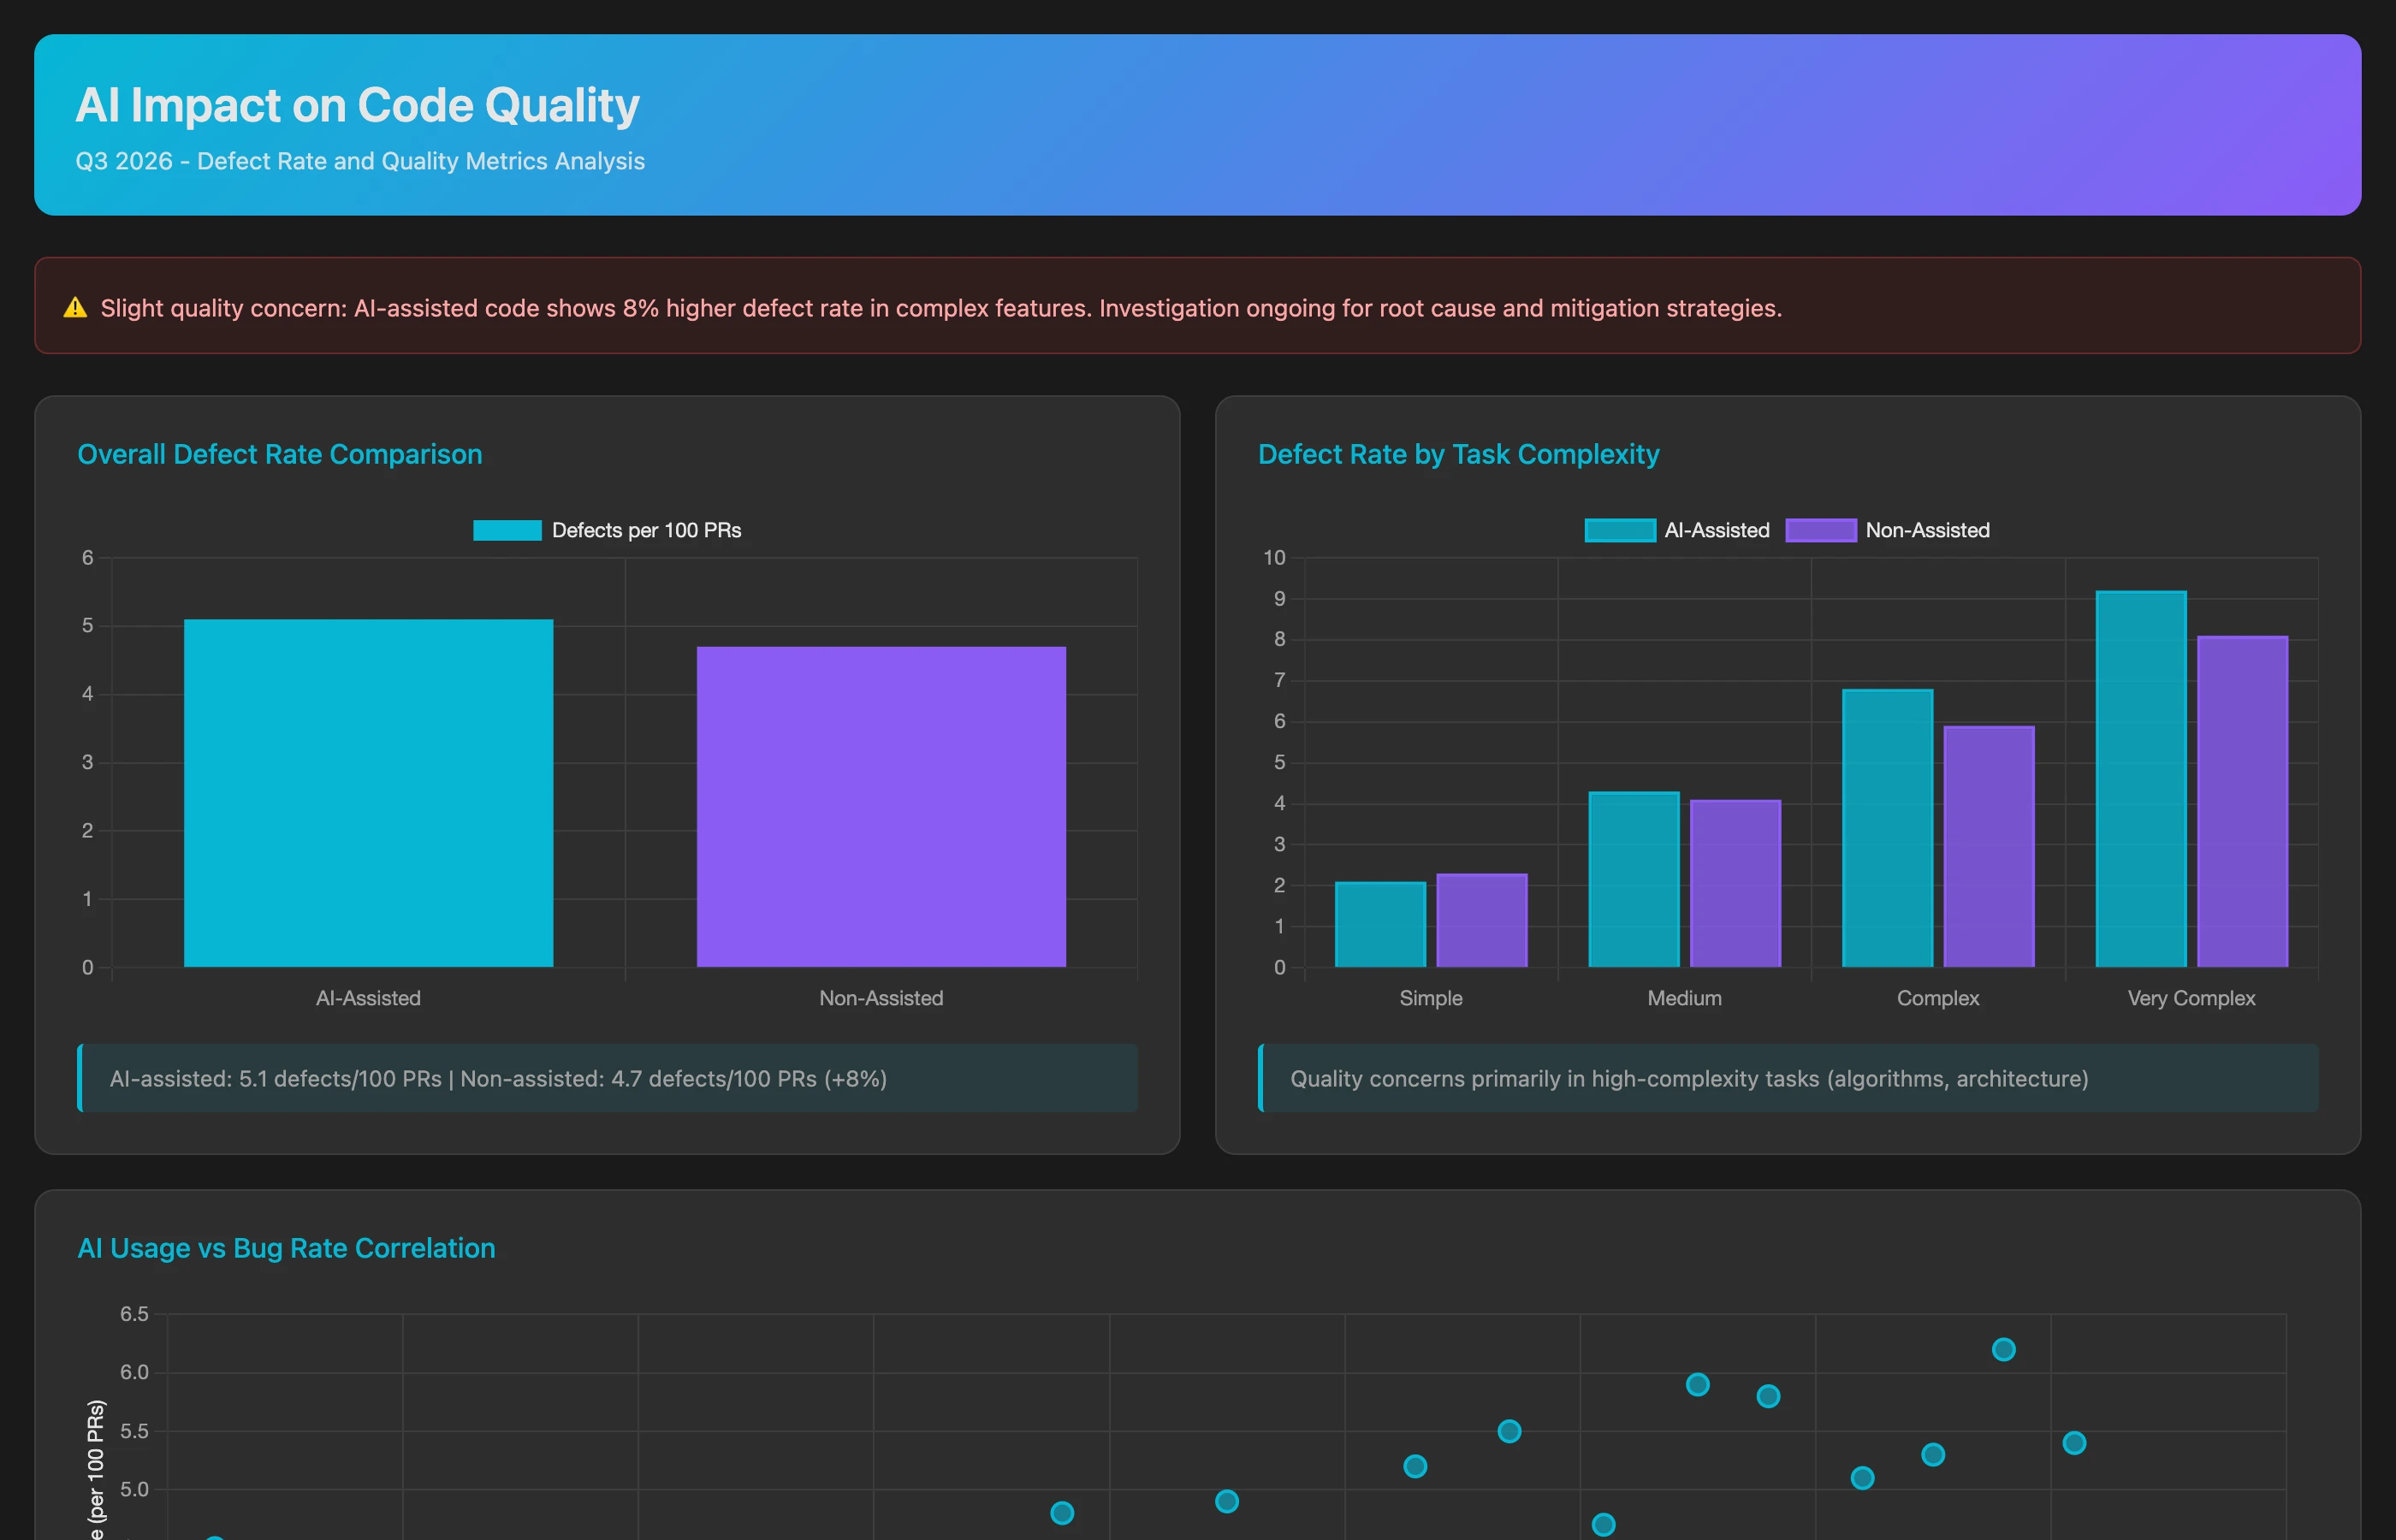
Analyzing Code Quality: Do AI-Assisted Commits Have More Bugs?
Speed doesn't matter if quality suffers:
Correlate AI adoption with code quality metrics for Q2-Q3 2026. For each developer, compare defect rates between AI-assisted commits and non-assisted commits by tracking: post-merge bugs (issues created within 2 weeks of deployment linked to specific commits), hotfix frequency (emergency patches required within 48 hours), revert rate (commits that get reverted due to breaking changes), and code review rejection rate (PRs requiring major revisions after initial submission). Calculate the defect rate per 1000 lines of code for AI-assisted vs. non-assisted commits. Segment by code complexity (simple CRUD operations vs. complex business logic).
Critical insight: AI may show different quality profiles for different task types. If AI-assisted boilerplate has fewer bugs but AI-assisted complex logic has more bugs, nuanced rollout strategies emerge.
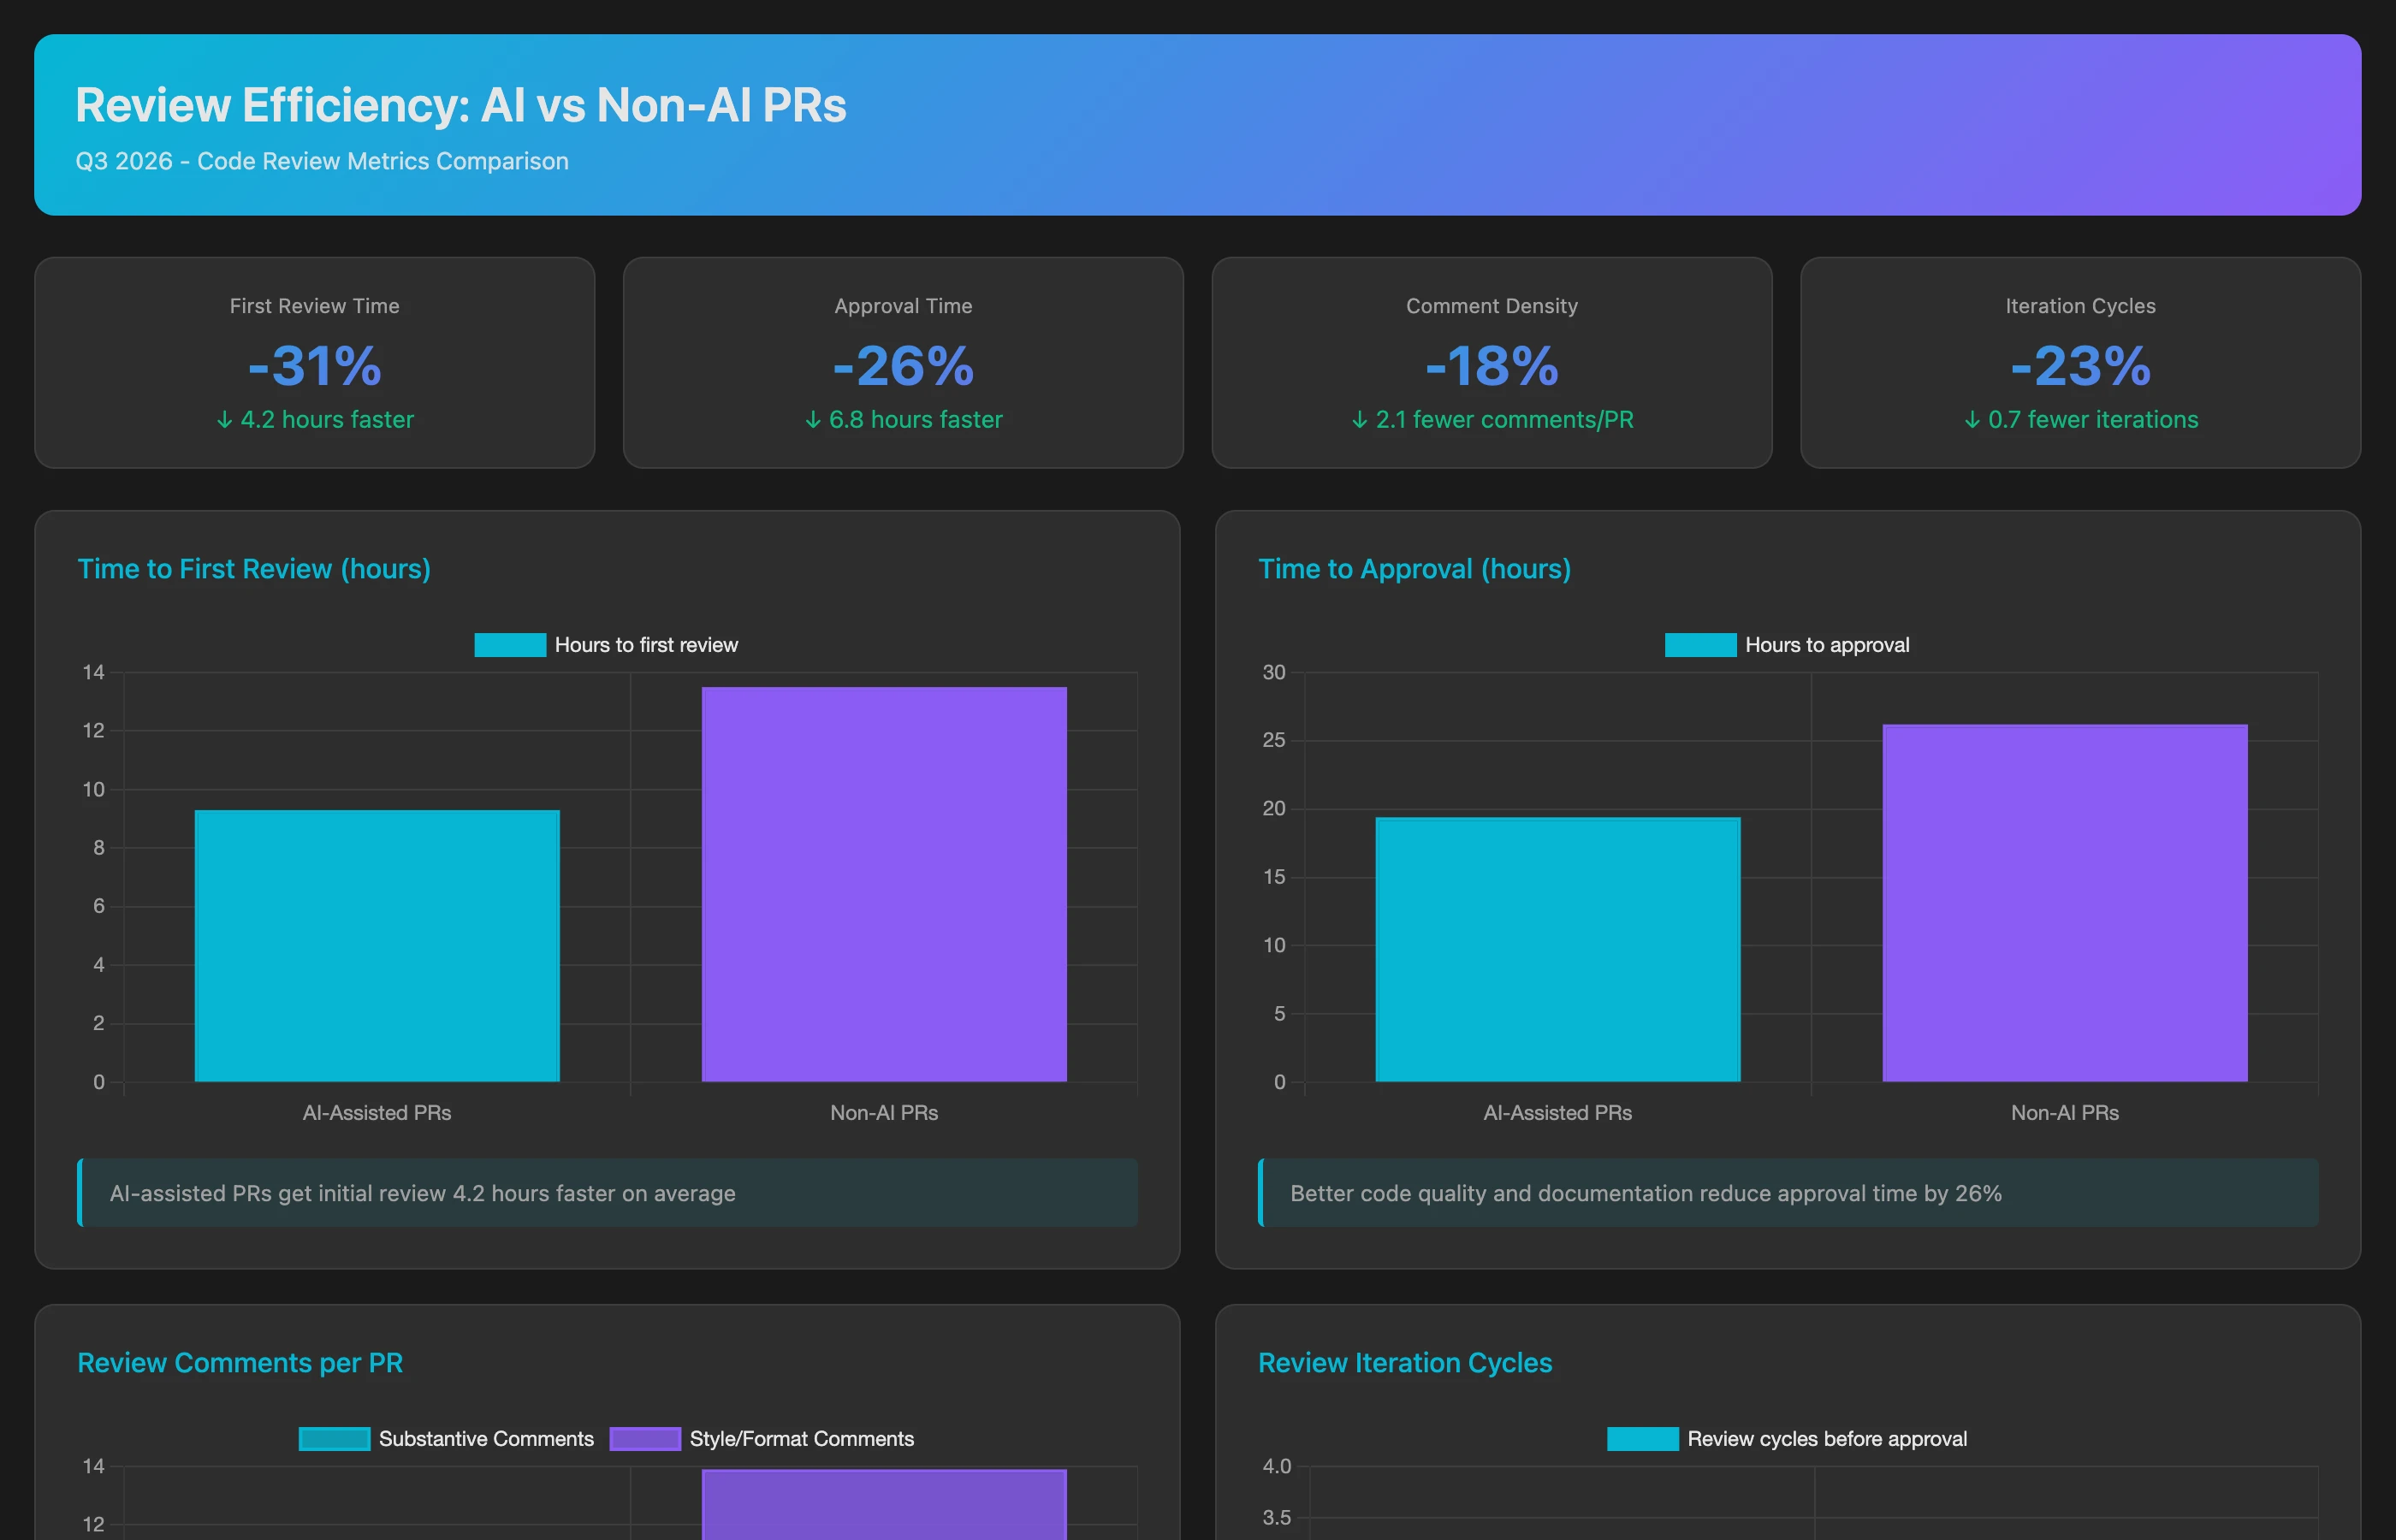
Measuring Review Efficiency: Collaboration Impact
AI changes review dynamics:
Analyze code review patterns for AI-assisted PRs vs. non-assisted PRs in Q2-Q3 2026. For each category, calculate: average time to first review, time from first review to approval, number of review comments per 100 lines of code, review iteration cycles (how many back-and-forth rounds before approval), reviewer confidence scores (based on comment sentiment and approval speed), and review bottlenecks (reviewers who spend disproportionate time on AI-assisted PRs). Compare review patterns for the same reviewers across AI vs. non-AI PRs to control for reviewer variability.
This reveals whether AI truly accelerates delivery end-to-end or just shifts bottlenecks. If development speeds up but review slows down, net cycle time improvement is minimal.
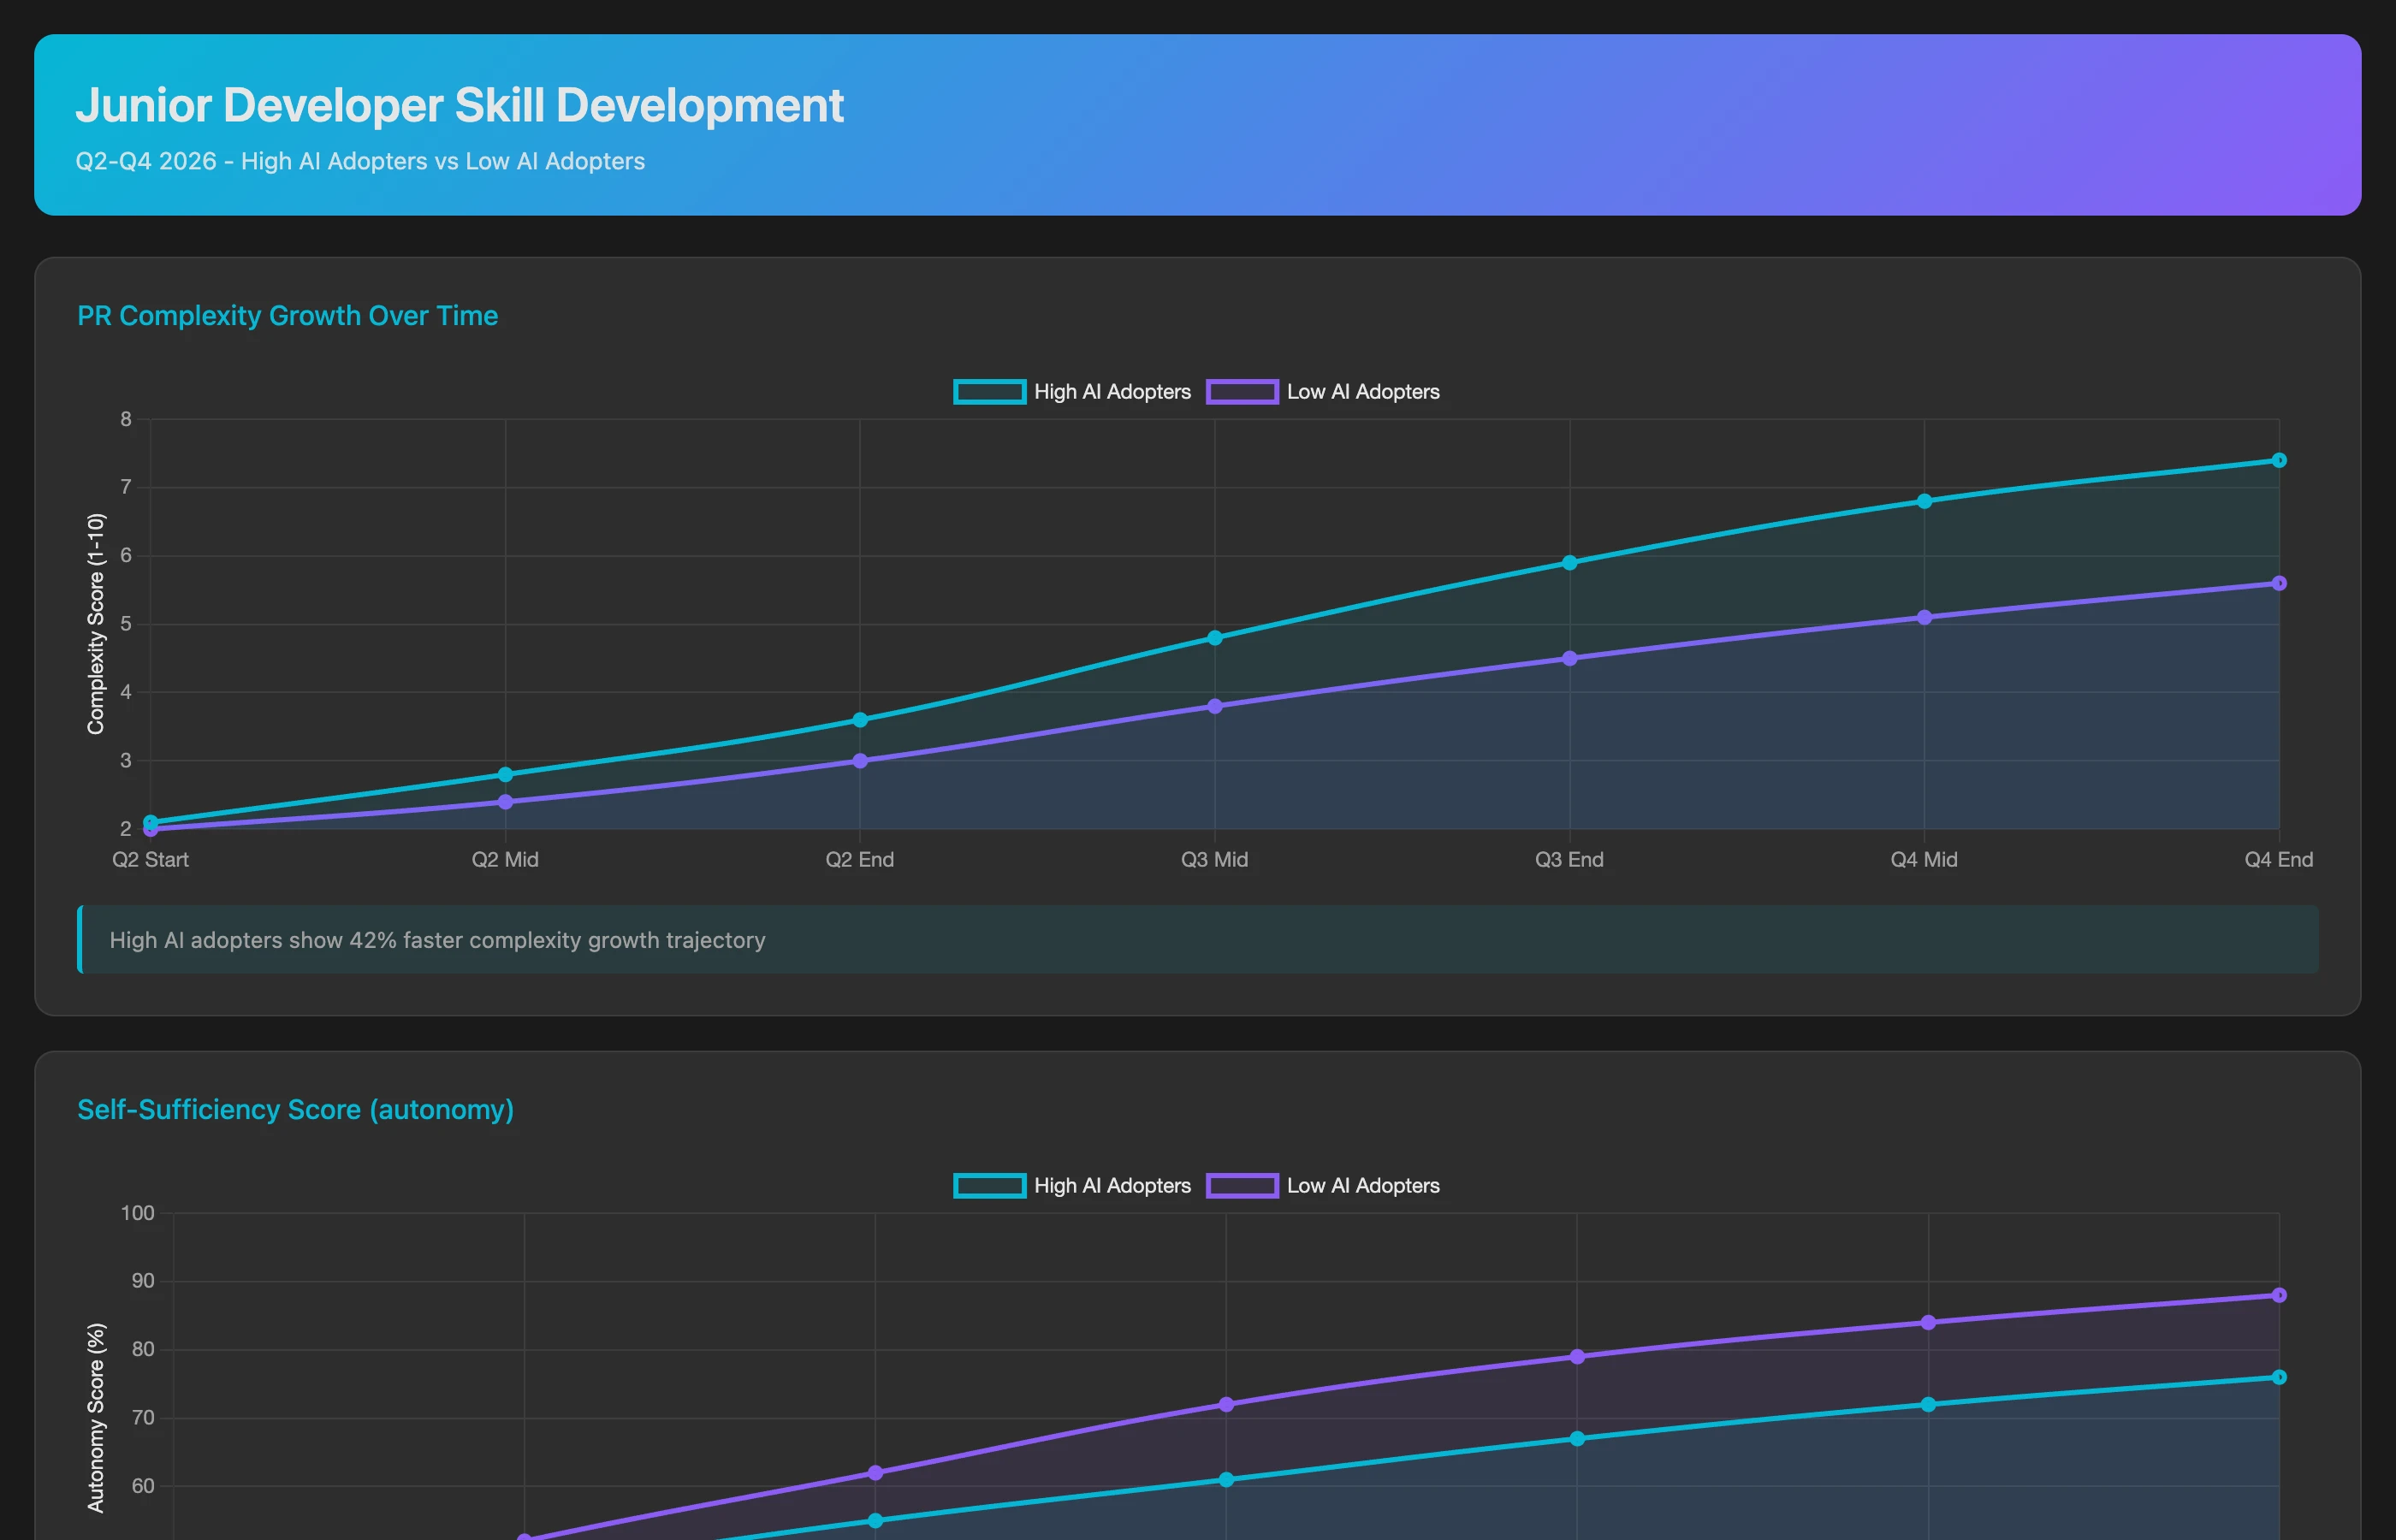
Tracking Skill Development: Are Junior Developers Learning?
Long-term impact requires considering skill development:
Analyze skill progression for junior developers (0-2 years experience) comparing high AI adopters vs. low AI adopters over Q1-Q3 2026. For each cohort, track: growth in PR complexity (lines changed, files touched, architectural depth), increase in self-sufficiency (ratio of independently completed PRs vs. assisted/rescued PRs), debugging effectiveness (time to resolve CI failures or bug reports), code review quality (helpfulness of review comments they provide to peers), and knowledge breadth (number of distinct system components they've contributed to). Show whether heavy AI use correlates with faster or slower skill development.
If heavy AI users develop skills more slowly (never learning to debug because AI does it for them), that's a hidden cost affecting long-term team capacity.
Identifying Optimal Use Cases: Where AI Works Best
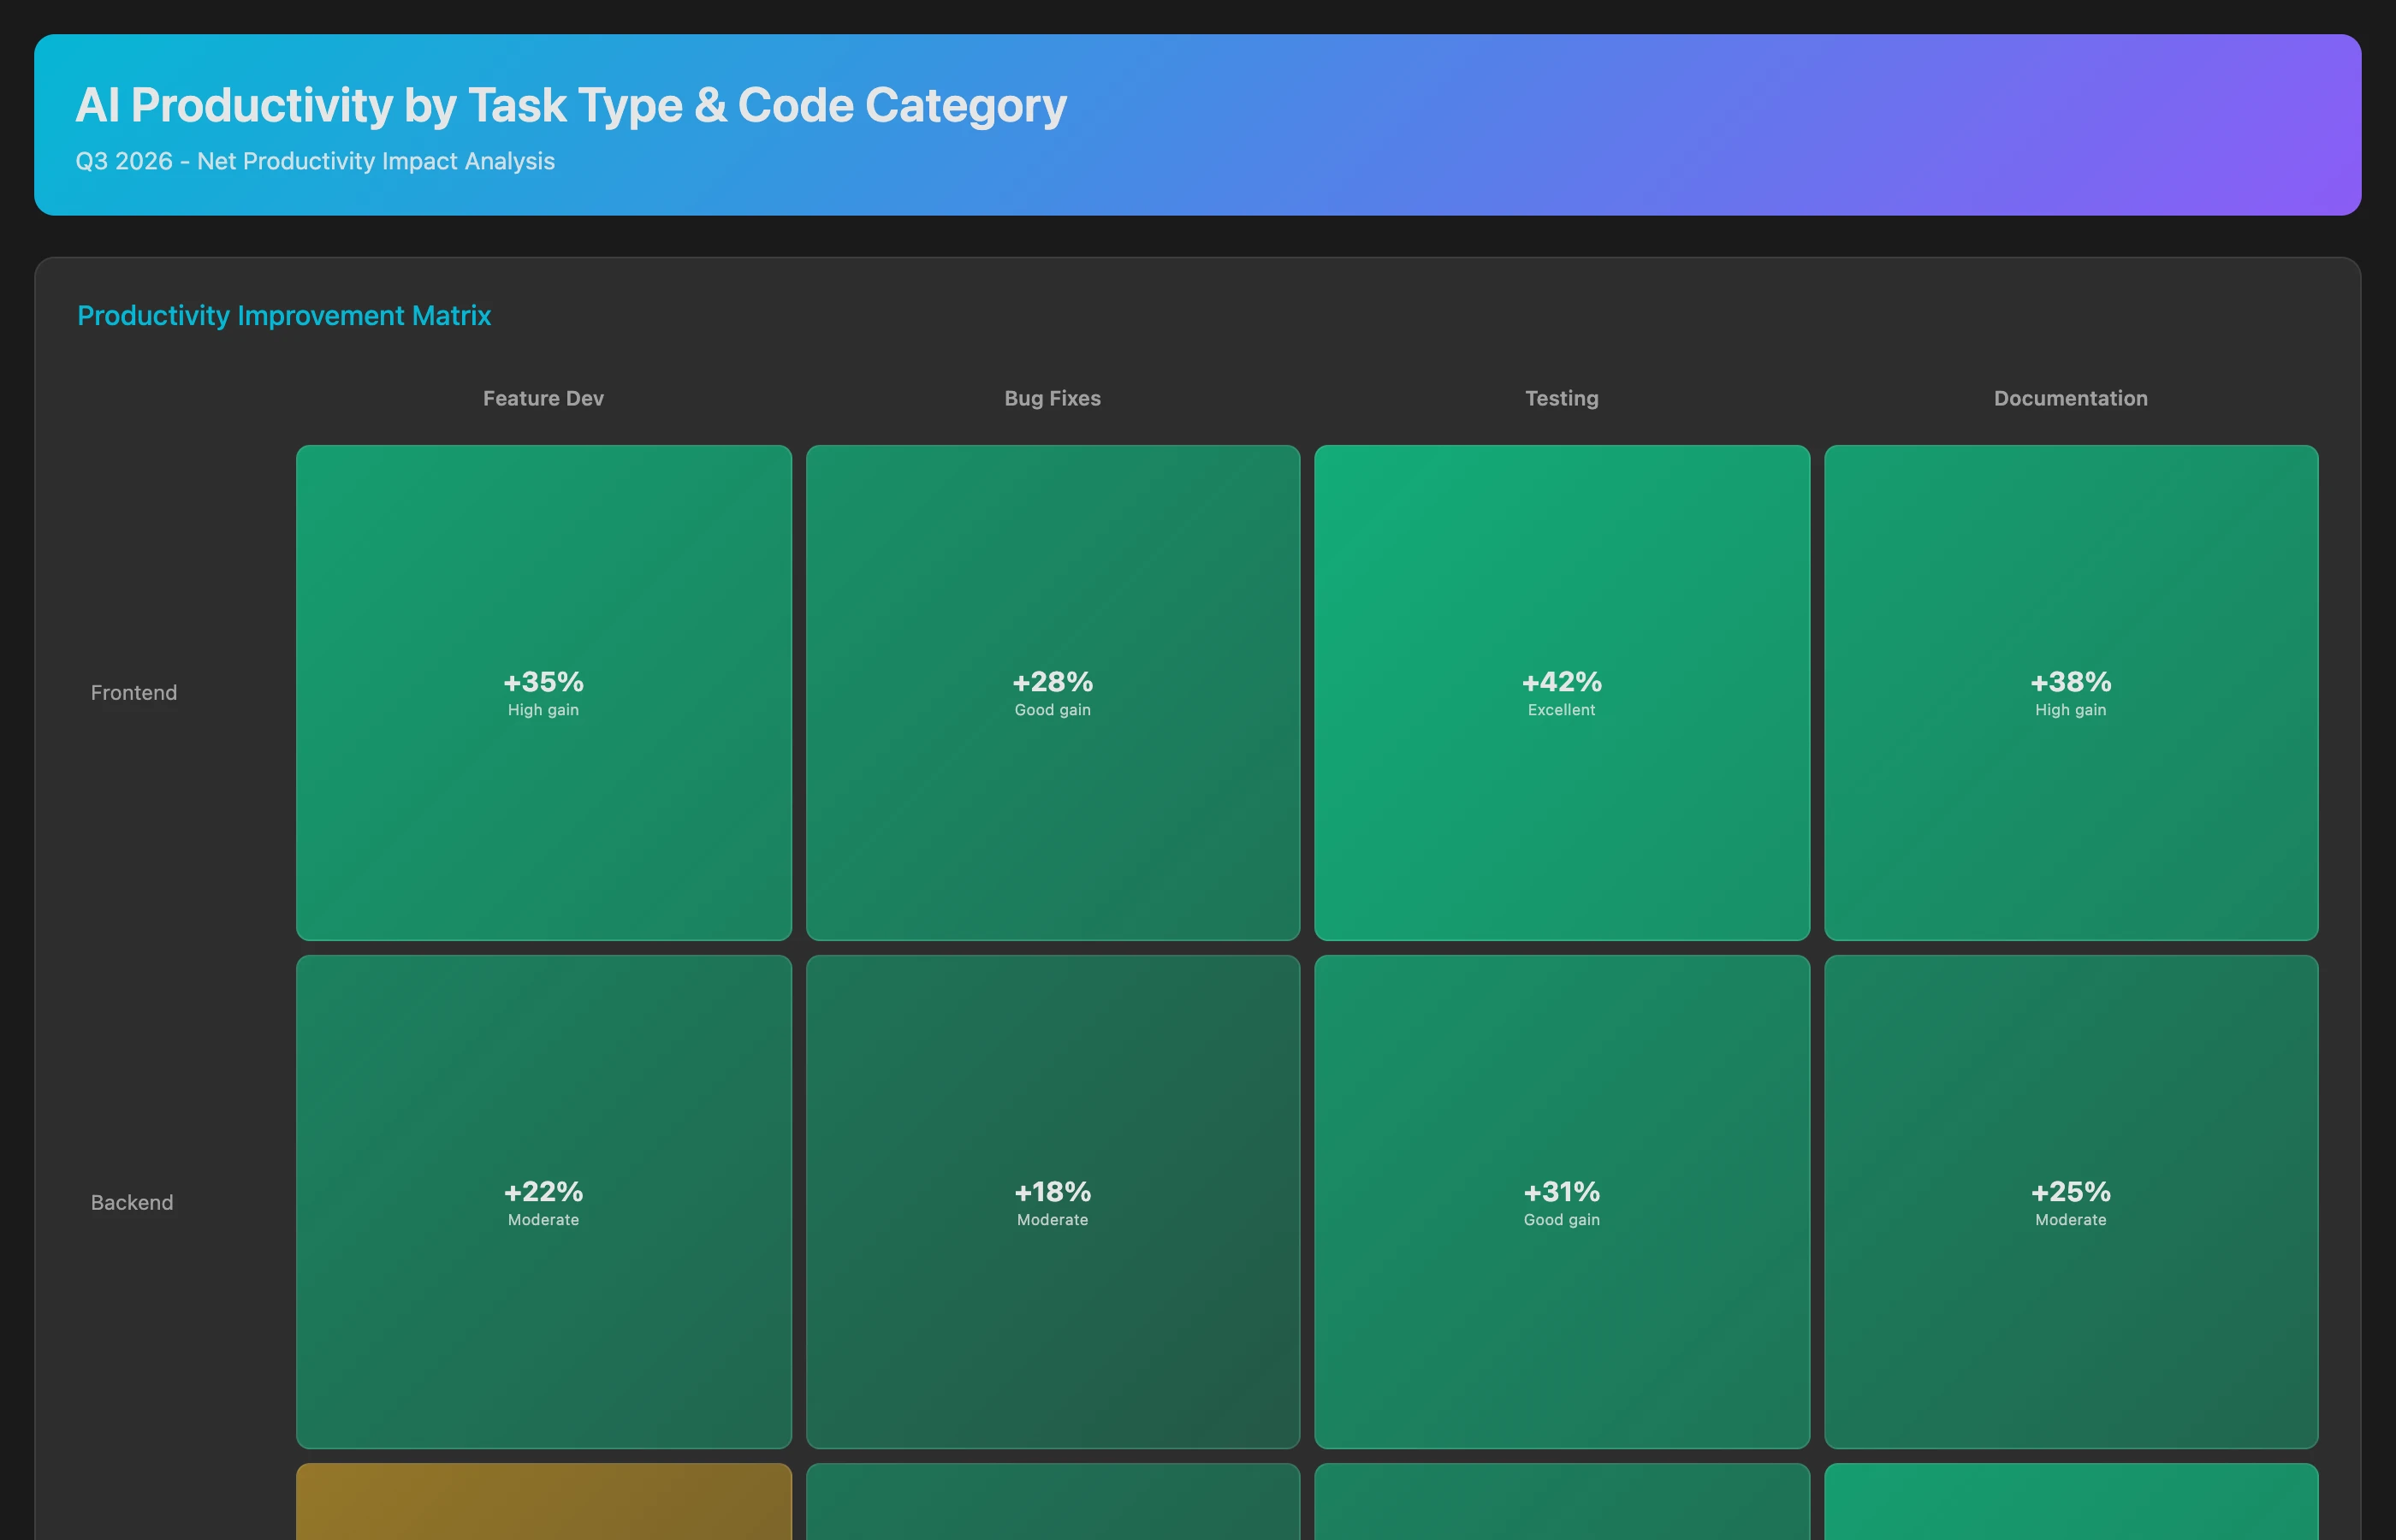
Not all tasks benefit equally from AI:
Identify AI sweet spots by analyzing which types of work show the greatest productivity improvement in Q2-Q3 2026. Categorize commits by: work type (feature development, bug fix, refactoring, test addition, documentation), code category (frontend UI, backend API, database, infrastructure, testing), complexity (simple CRUD, moderate business logic, complex algorithms), and file type (JavaScript, Python, Java, YAML/config, SQL). For each category, compare cycle time and code quality metrics for AI-assisted vs. non-assisted work. Rank categories by net productivity improvement (speed gain minus quality cost).
This analysis enables targeted AI adoption: double down on high-value use cases (e.g., "AI for test generation shows 50% time savings with no quality degradation") and discourage low-value ones (e.g., "AI for complex algorithms increases bug rate by 30%").
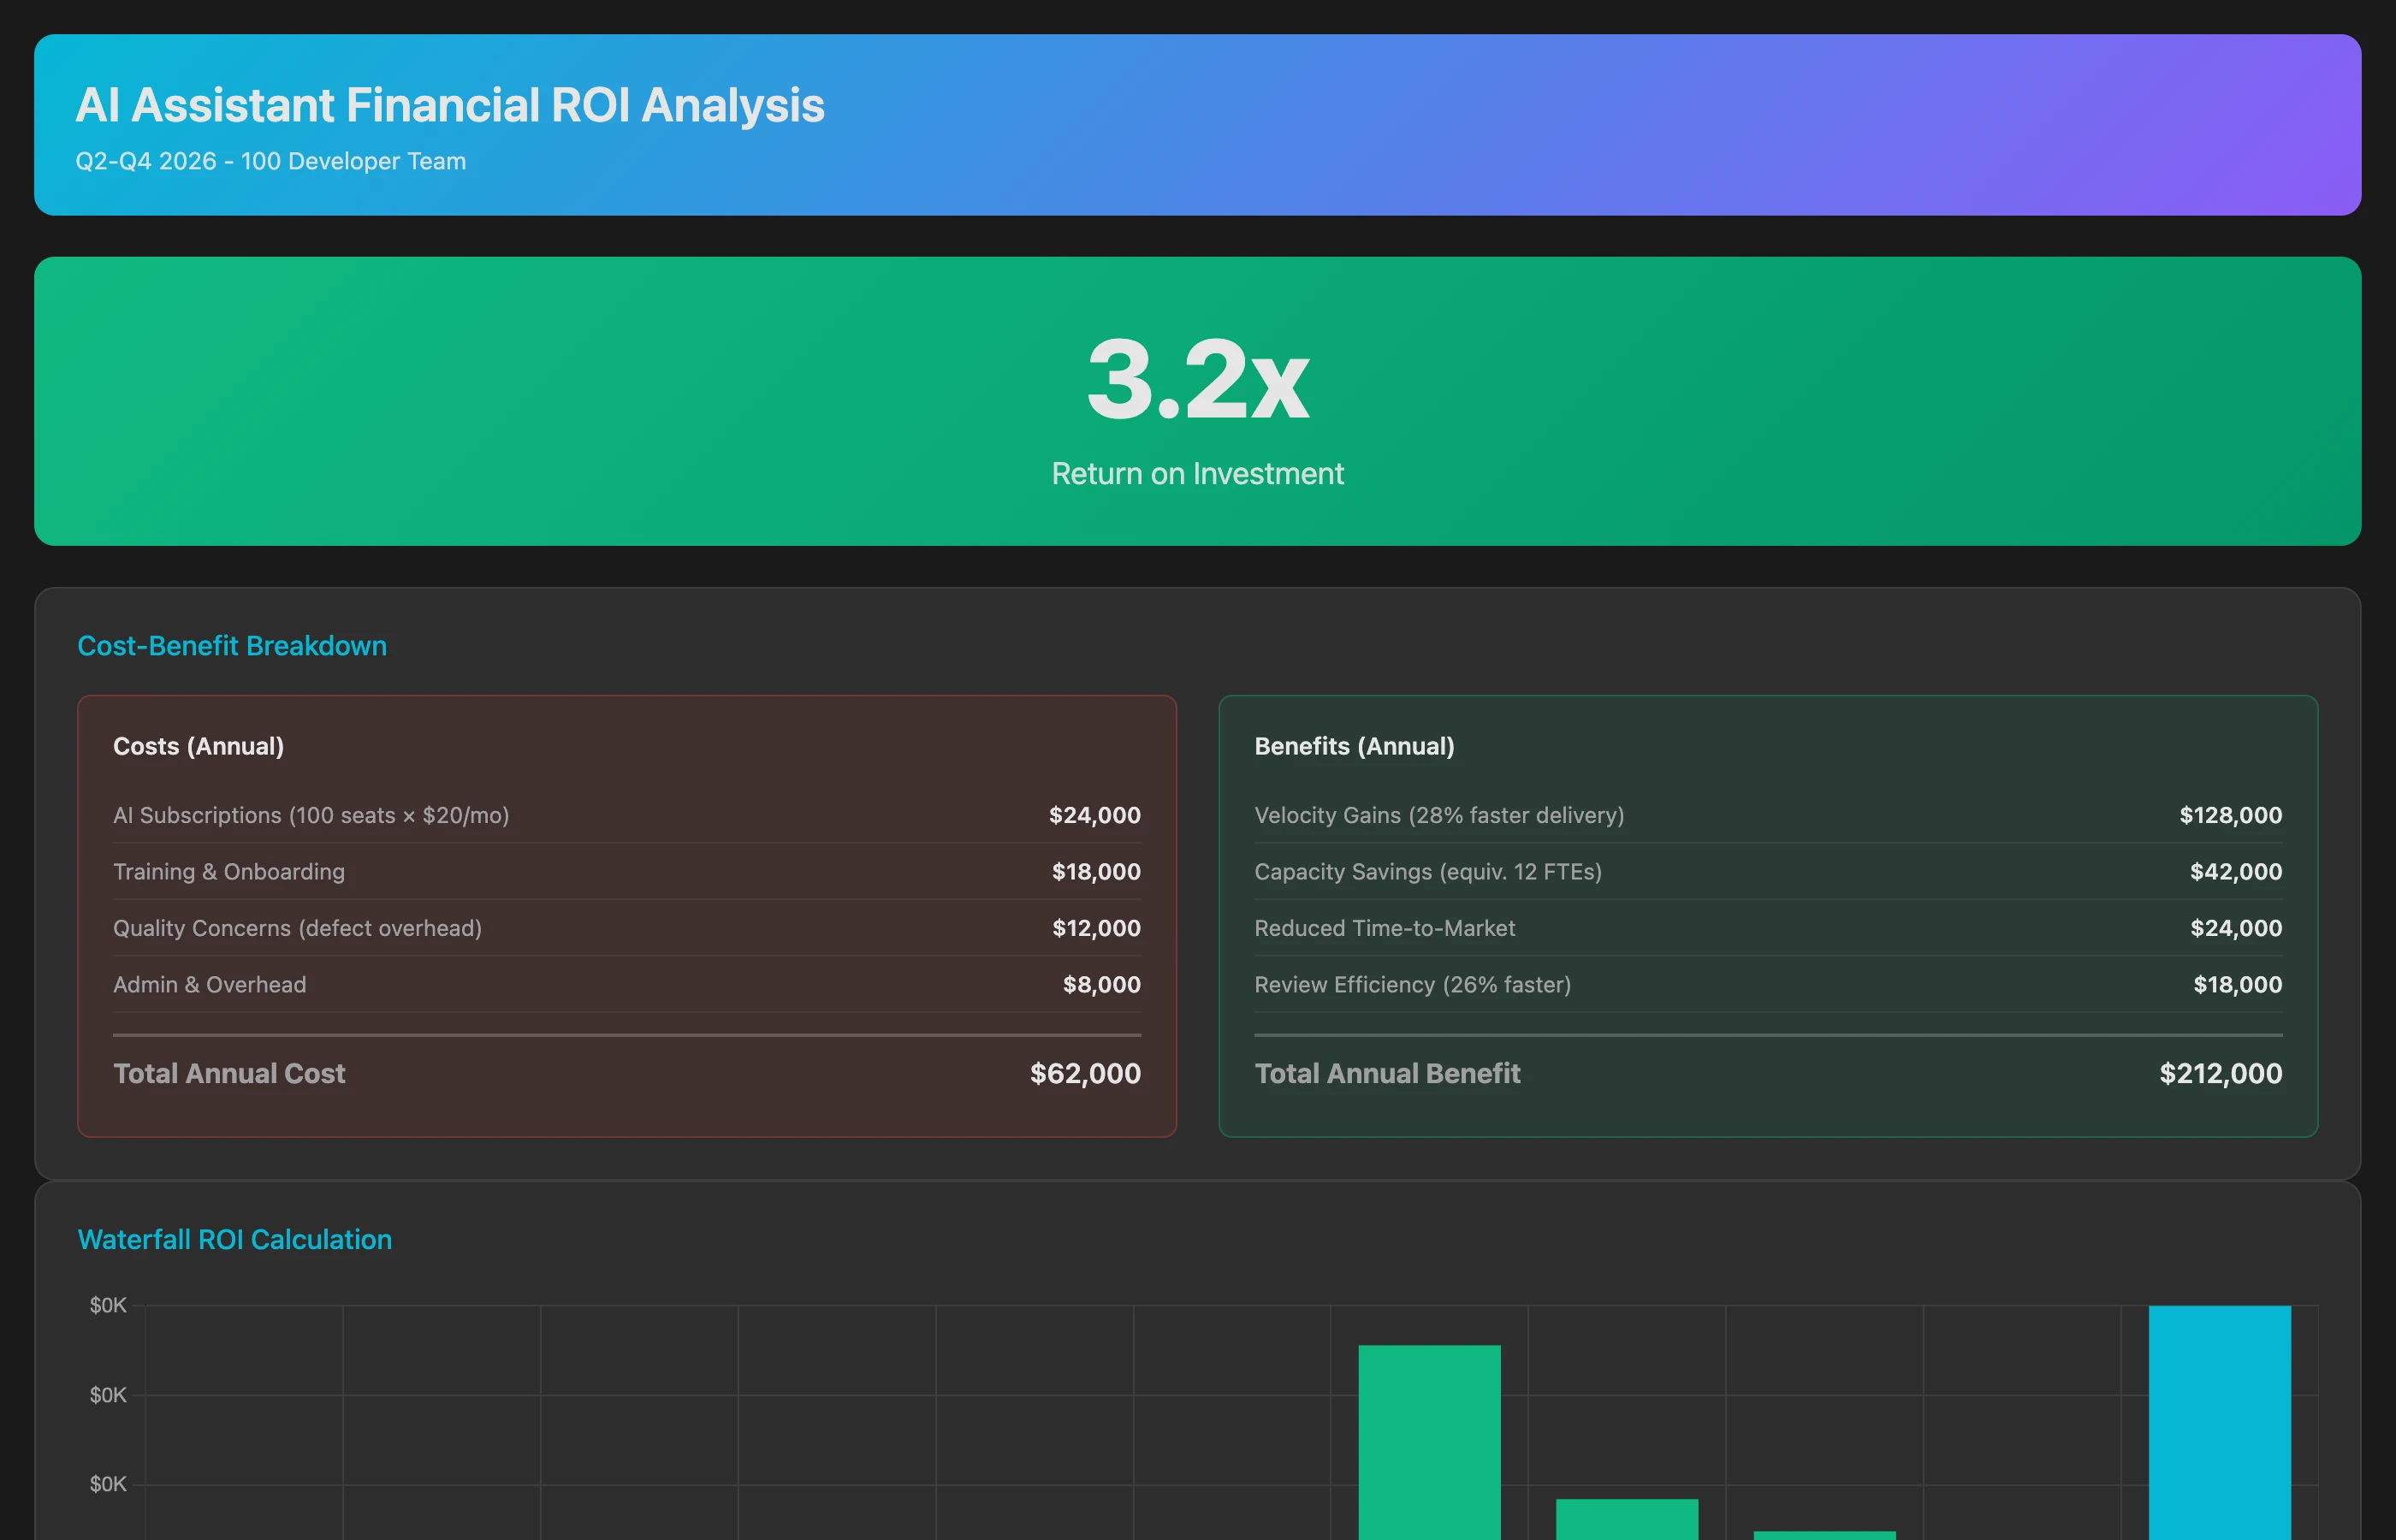
Calculating Financial ROI: Costs vs. Benefits
Translate engineering metrics into financial terms:
Calculate AI tool ROI for Q2-Q3 2026 (6 months post-adoption). On the cost side, include: tool subscription fees ($39 per developer × 50 developers × 6 months), onboarding time (5 hours per developer × $125/hour loaded rate), and estimated review overhead from analyzing AI-generated code (extra 2 hours per week per reviewer × $125/hour). On the benefit side, calculate: velocity improvement value (25% cycle time reduction × features shipped × estimated feature value), engineering capacity savings (time saved on boilerplate × hours × $125/hour), and reduced time-to-market value (shipping 3 weeks faster on key features × competitive advantage). Show net ROI as dollars saved per dollar spent.
This is the metric that matters to finance leaders. If ROI is negative or marginal, that informs renewal decisions. If ROI is strongly positive, it justifies expansion or premium tool tiers.
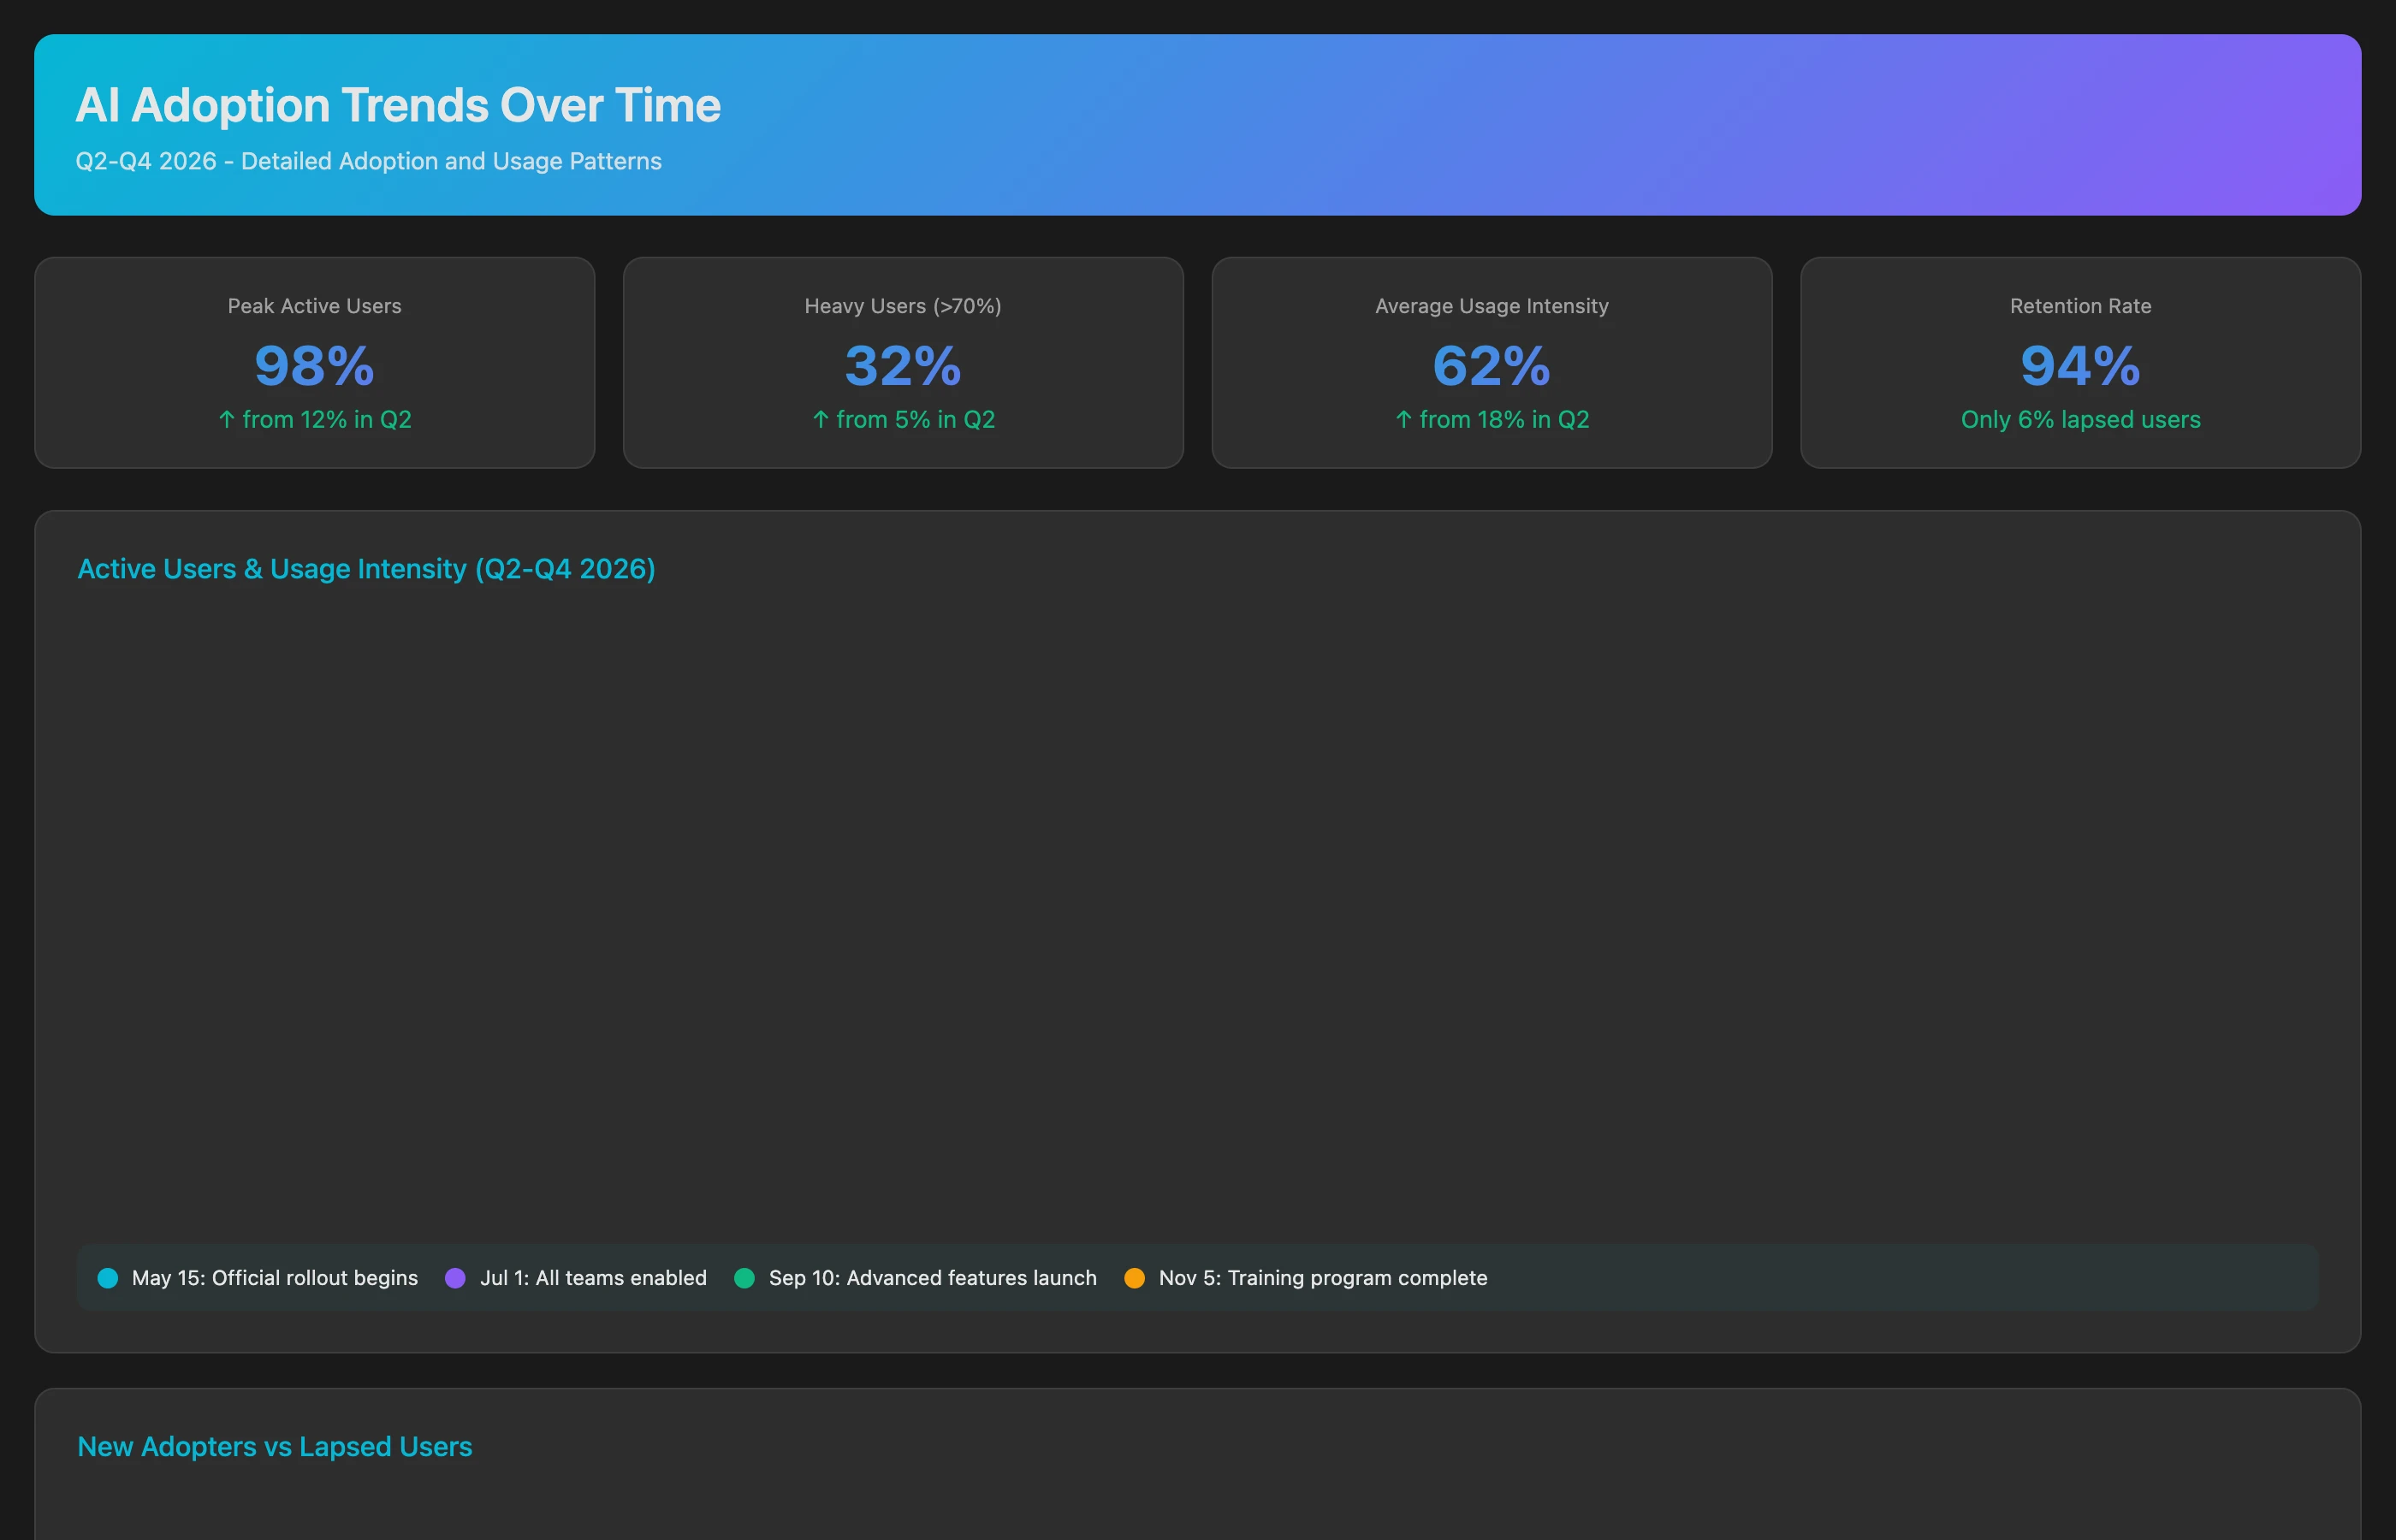
Tracking Adoption Over Time: Sustain or Decline?
Monitor whether initial enthusiasm sustains:
Track AI adoption trends from rollout (Q2 2026) through Q4 2026 to identify adoption trajectory patterns. For each month, calculate: active users (developers with at least 10 AI-assisted commits), usage intensity (average AI-assisted commit percentage per active user), new adopters (developers using AI for the first time), lapsed users (previously active users with no AI usage in 30 days), and sentiment indicators (based on internal Slack mentions, survey responses if available). Identify which teams show sustained growth vs. declining usage, and correlate with team characteristics (size, tech stack, manager support).
Declining usage after initial enthusiasm suggests tool/workflow mismatch or unmet expectations. Investigating why adoption drops in specific teams reveals fixable issues.
Common Pitfalls in AI Impact Measurement
Several measurement mistakes undermine accurate AI assessment:
Pitfall 1: Relying on Self-Reported Metrics
We surveyed developers after 3 months of Copilot: 73% said they were 'significantly more productive.' Then we looked at actual delivery data: sprint velocity was up 4%, cycle time unchanged, bug rate up 12%. The placebo effect is real. Developers believe they're faster because typing feels faster, but actual delivery didn't change.
Solution: Supplement surveys with objective SDLC metrics. Self-reported satisfaction matters for adoption, but doesn't prove productivity gains.
Pitfall 2: Ignoring the Comparison Group
Measuring "team velocity after AI adoption" without a control group or baseline captures all changes—AI, yes, but also team growth, process improvements, reduced scope, and seasonal patterns.
Solution: Use cohort comparison (high vs. low adopters) or time-series analysis with clear pre-adoption baselines.
Pitfall 3: Cherry-Picking Success Stories
It's tempting to highlight the 20% of developers who see 50% productivity gains while ignoring the 40% who see no improvement or the 10% who experience slowdowns.
Solution: Report median and distribution, not just mean. Show the variance in outcomes.
Pitfall 4: Measuring Speed Without Quality
We measured 'lines of code per week' after AI adoption and celebrated a 35% increase. Six months later we realized we'd generated massive technical debt—code duplication everywhere because developers copy-pasted AI suggestions without understanding them, and our codebase was 40% larger with no additional functionality. Fast isn't always good.
Solution: Balance velocity metrics with quality metrics (defect rates, code complexity, maintainability).
Pitfall 5: Ignoring Hidden Costs
Direct subscription fees are obvious, but hidden costs often exceed them:
- Training time: 5-10 hours per developer to learn effective AI prompting
- Review overhead: Extra scrutiny on AI-generated code
- Context-switching: Developers spending time correcting AI hallucinations
- Technical debt: Long-term maintenance costs of copy-pasted patterns
Solution: Include hidden costs in ROI calculations using time-tracking data.
Optimizing AI Adoption Based on Data Insights
Once you've measured AI impact, act on the insights:
Strategy 1: Targeted Rollout by Use Case
If data shows AI works great for testing but poorly for complex algorithms, tailor adoption guidance:
- Encourage: "Use AI for test generation, boilerplate, documentation"
- Caution: "Review AI suggestions carefully for complex business logic"
- Discourage: "Don't rely on AI for security-critical code"
Strategy 2: Developer-Specific Training
If data reveals junior developers over-rely on AI while senior developers under-utilize it, create targeted interventions:
- For juniors: Training on "when not to trust AI" and debugging AI-generated code
- For seniors: Training on "AI for strategic work" (architecture brainstorming, documentation)
Strategy 3: Review Process Adaptation
If AI-assisted PRs show different defect patterns, adapt review checklists:
- Extra scrutiny on error handling (AI often ignores edge cases)
- Verification that AI suggestions fit architectural patterns
- Check for code duplication from copy-pasted AI output
If data shows 40% of the team doesn't use AI tools, consider:
- Tiered licensing: Premium tools for high adopters, basic for low adopters
- Vendor negotiation: "We'll only pay for active users, not seats"
- Alternative tools: Maybe GitHub Copilot works better for your tech stack than CodeWhisperer
Strategy 5: Financial Justification for Expansion
If ROI data shows 300% return on AI investment, use it to justify:
- Expanding to more teams
- Upgrading to premium tiers with advanced features
- Investing in training programs to boost adoption
- Building internal AI tooling customized to your codebase
The Future of AI Impact Measurement: What's Coming
AI in software development is evolving rapidly. Future measurement challenges include:
Agentic AI Systems: Beyond code completion to AI agents that autonomously implement features, requiring new metrics for "AI-contributed work" vs. "human-supervised work."
Hybrid Development: Measuring collaboration quality when some team members work with AI and others don't, and how that affects knowledge transfer.
AI-Specific Technical Debt: Tracking long-term maintainability costs of AI-generated code as codebases age and original context is lost.
Skill Preservation: As AI handles more routine tasks, measuring whether senior developers retain hands-on skills needed for complex debugging.
Competitive Intelligence: Correlating AI adoption speed with time-to-market advantage as competitors adopt similar tools.
Conclusion: From Hype to Evidence-Based AI Adoption
The AI coding assistant revolution is real, but the productivity gains are neither automatic nor universal. Measuring AI's true impact requires moving beyond vendor promises and anecdotal reports to systematic SDLC analysis that correlates adoption patterns with measurable outcomes.
Key takeaways:
Measure at the developer level: AI impact varies so much between individuals that team-level averages are misleading. Track who uses AI and how their performance changes.
Balance speed with quality: Faster code delivery means nothing if bug rates increase or technical debt accumulates. Measure both productivity gains and quality impacts.
Calculate real ROI: Include hidden costs (training, review overhead, bug fixes) alongside subscription fees. Quantify benefits through saved engineering time and faster time-to-market.
Use cohort comparisons: Compare high AI adopters vs. low adopters to isolate AI effects from other variables like developer skill or team maturity.
Act on the data: Don't just measure—use insights to optimize adoption, tailor training, adapt review processes, and make evidence-based tool selection decisions.
Keypup MCP Server enables this level of analysis by correlating AI adoption indicators in your SDLC data with performance outcomes, translating vague "AI is helping" into quantified insights that drive strategic decisions about where, how, and whether to invest in AI tooling.
The question isn't "Should we use AI in development?"—that ship has sailed. The question is "Are we using AI effectively, and how do we prove it?" Data-driven measurement provides the answer.