A chart has two primary functions: displaying data and inviting further exploration of a topic. Data can be illustrated visually by charts when a simple table cannot adequately depict relationships between data points or patterns in the dataset.
Here's how you can create a chart with Keypup in 6 easy steps:
Add a chart to a dashboard
Click on the + Add chart button on the top right corner of any dashboard.
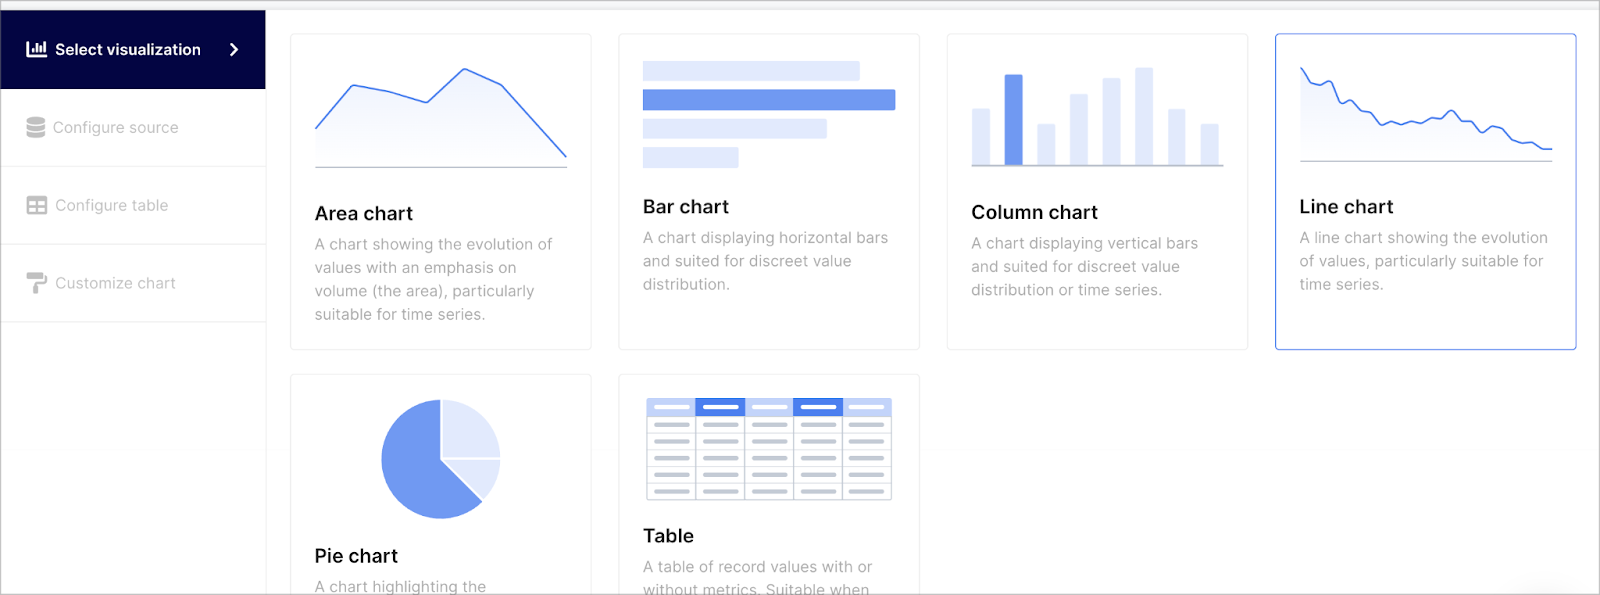
Select your visualization type
Click on the visualization that will best express your data points. You can choose from the following options :
- Area chart: to show trends over time, starting with a common baseline. For illustrating precision values or a large number of datasets, area charts don't work well.
- Bar chart: This type of graph is meant to illustrate relationship information quickly, as the bars represent quantities for a particular category.
- Column chart: This graph uses vertical bars to show comparison between categories (labels as example). There are two axes: one displaying the categories being compared, the other, the data values. They offer a clear picture of a situation at a point in time.
- Line chart: Also known as a line plot or a line graph is a visualization in which lines connect individual data points. In line charts, quantitative values are displayed over a specified period of time.
- Pie chart: This visual shows a parts-to-whole relationship between categorical or nominal data. Pie slices represent percentages of the whole. When categorical data are analyzed, they are often divided into groups and the responses are arranged in a specific order.
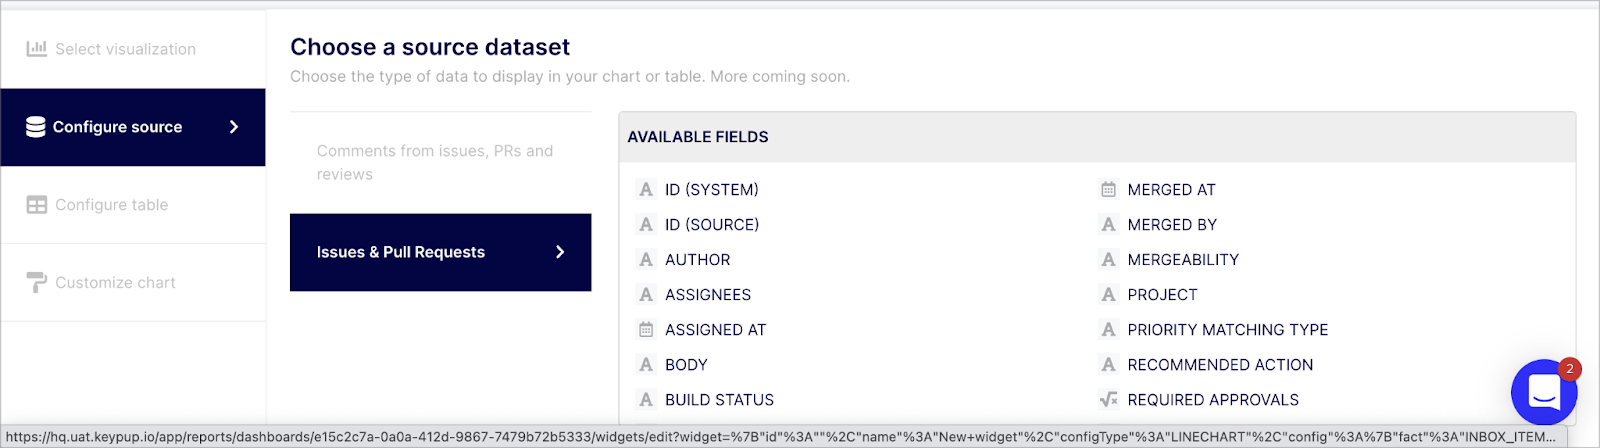
Select a data source
On the navigation menu located on the left side of the screen, select the “Configure source” tab. Based on the applications connected, Keypup fetches various datasets such as “Issues & Pull Requests” for instance. While selecting a dataset, you can see the various fields you can query on each dataset on the table located on the right side of your screen, titled “AVAILABLE FIELDS”. Select the dataset containing the fields you would like to use in your chart.
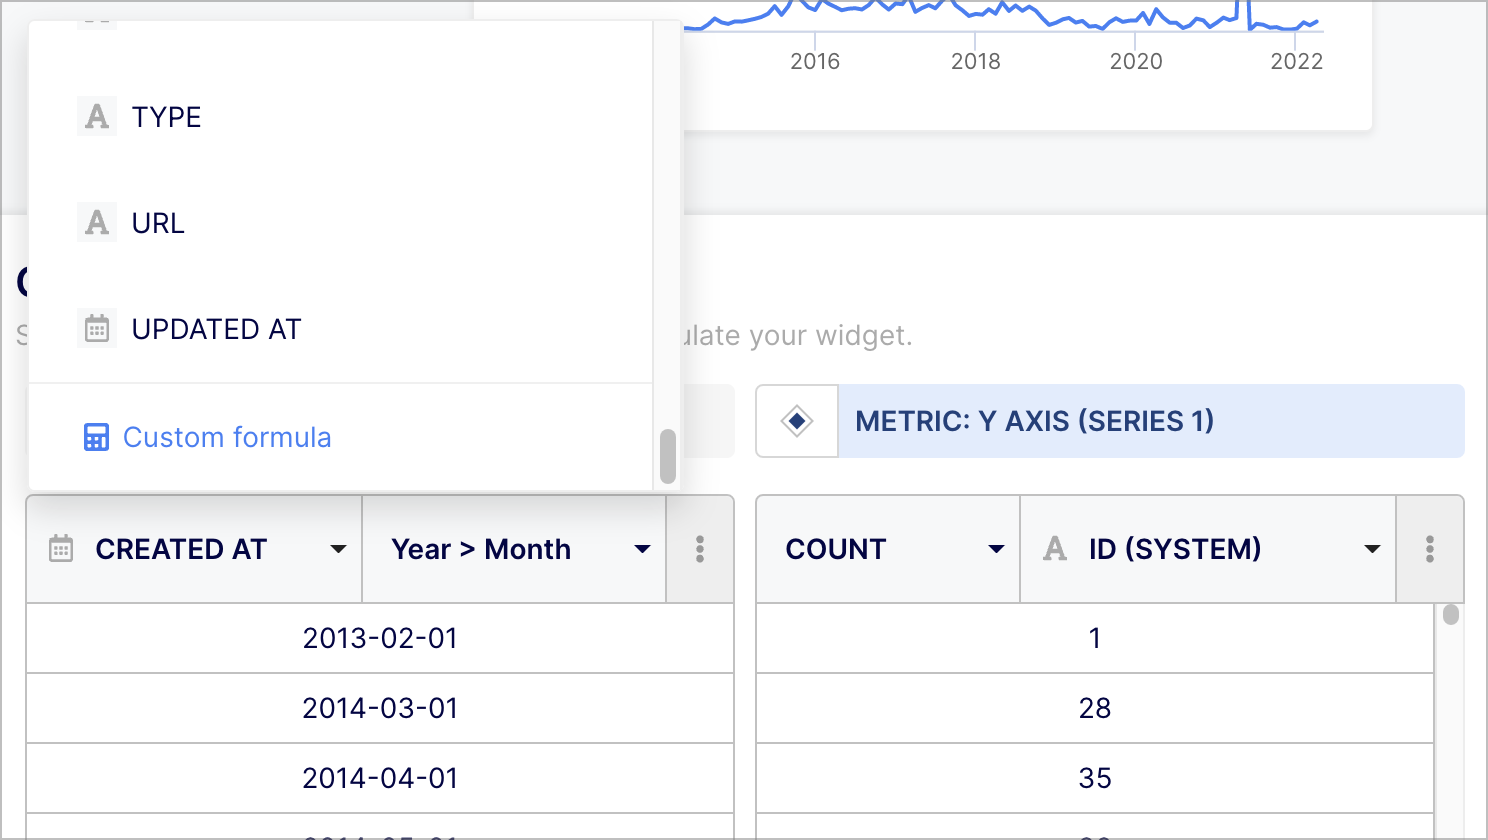
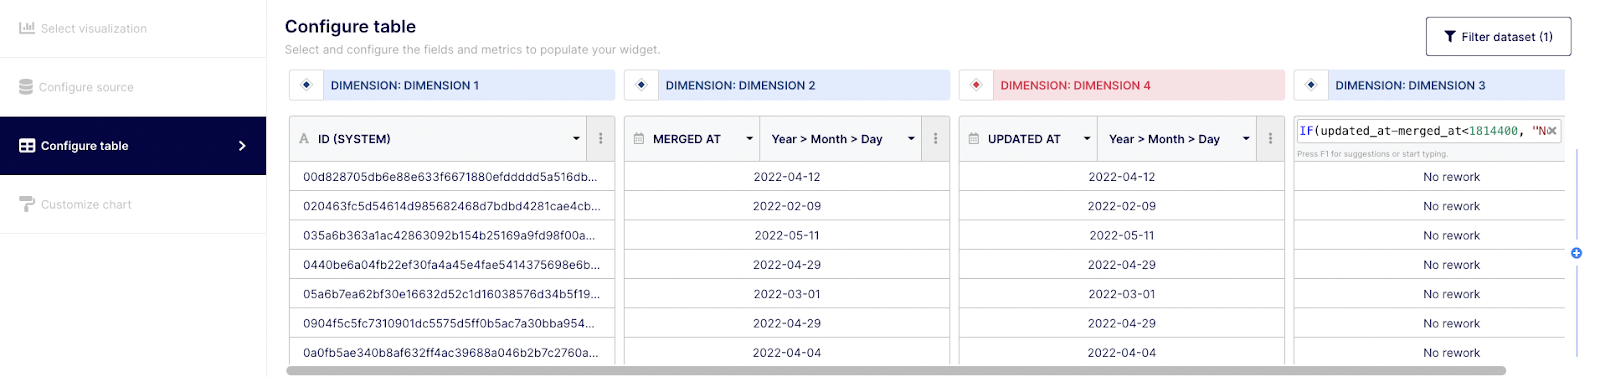
Query your selected dataset
Now that you have selected your visualization type and data source, you can start building your insight by querying your dataset. To do so, select the “Configure table” tab on the navigation menu on the left. By default, the table will contain two column types: Dimensions and Metrics.
“Dimensions” are field attributes of your datasets.
For example, it could be a date of merging, an author or a label.
“Metrics” are the numerical values aggregated from the function applied to a specific field (Dimension).
Note : the number of displayed columns (Dimensions and Metrics) varies based on the selected chart. You can add “metrics” columns by clicking on the (+) sign button on the right side of the column or remove it by clicking on the expand (...)button and select the “delete” option.
Depending on your familiarity with query building, you can perform basic or advanced queries. To do so, simply select the field(s) you want to explore from the drop-down menu at the top of the “Dimension” column or select “custom formula”.
Then, select the function and field associated or “custom formula” from the drop-down menu at the top of the “Metric” column.
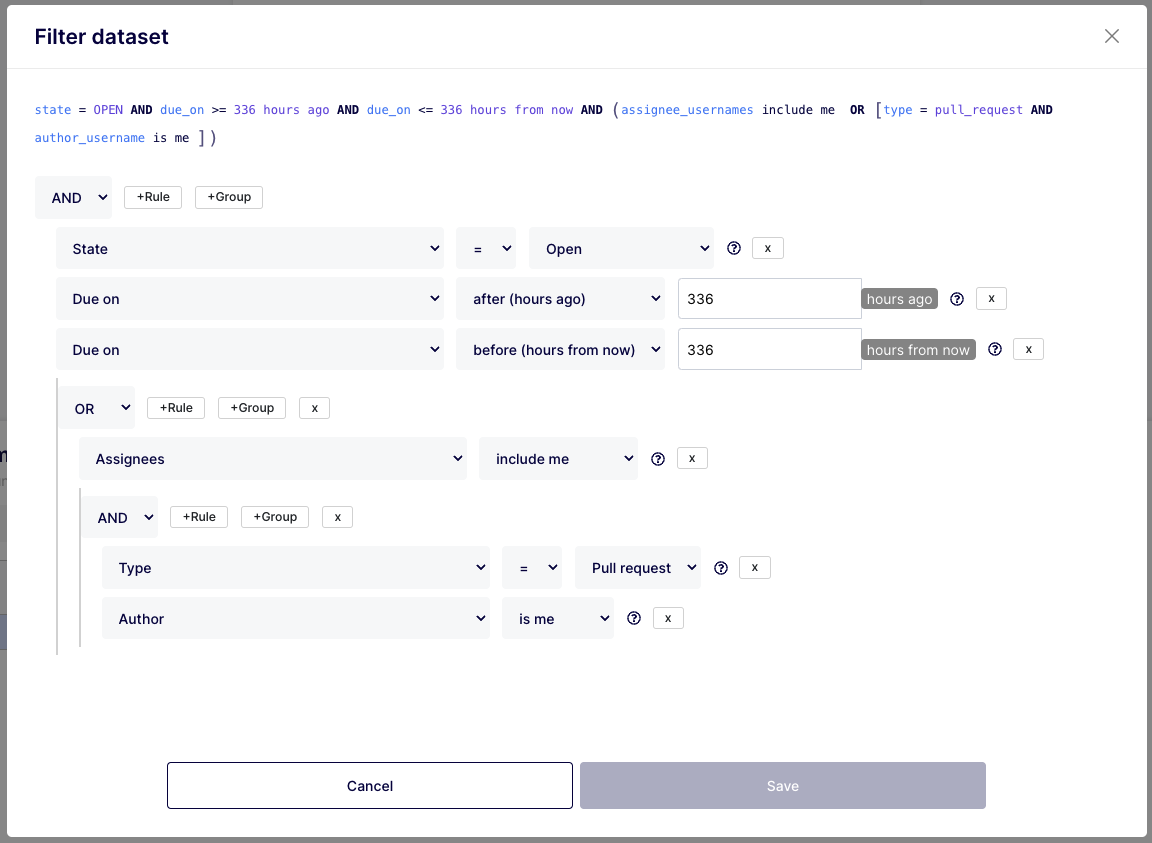
Apply a filter (optional)
If you need to narrow-down your insight, and based on the nature of the field(s) you built your report on, you can apply a filter with “AND” & “OR” operators. To do so, simply click on the “Filter dataset” button at the top right corner of your insight builder interface.
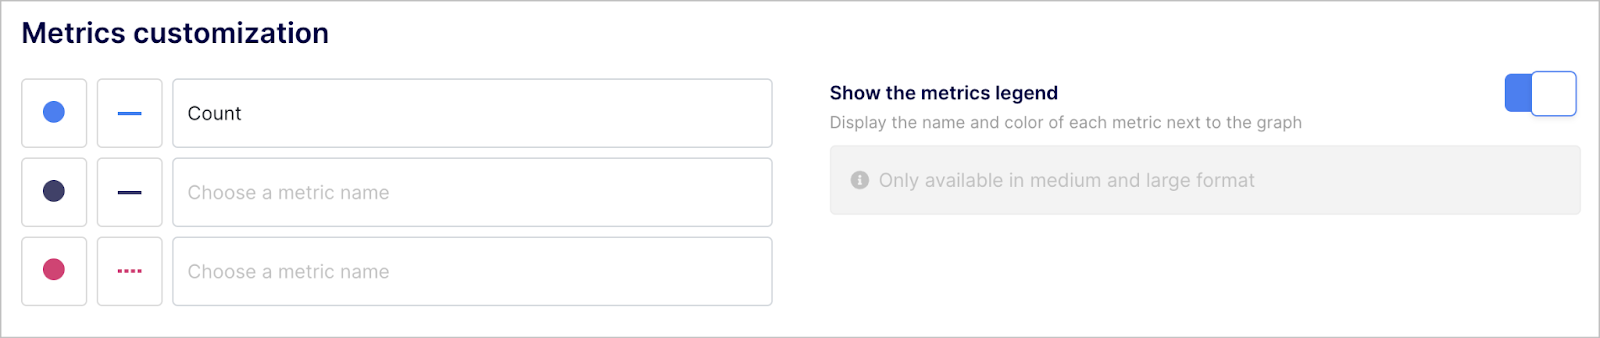
Customize your chart “look & feel” (optional)
Cosmetic customization is automatically suggested based on your chart type. For readability purposes, you can further customize charts by tweaking the colors but also by updating the title, labels and legend.
Any questions or tips you would like to share? You can contact us directly in the chat from your Keypup interface or use this contact form.